Prometheus can do more than monitor Oracle WebLogic Server. It can automatically scale clusters, too.
Elasticity (scaling up or scaling down) of an
Oracle WebLogic Server cluster lets you manage resources based on demand and enhances the reliability of your applications while managing resource costs.
In this article, you’ll learn the steps required to automatically scale an Oracle WebLogic Server cluster provisioned on WebLogic Server for OCI Container Engine for Kubernetes through an Oracle Cloud Marketplace stack when a monitored metric (the total number of open sessions for an application) goes over a threshold. The
Oracle WebLogic Monitoring Exporter application scrapes the runtime metrics for specific WebLogic Server instances and feeds them to Prometheus.
Because Prometheus has access to all available WebLogic Server metrics data, you can use any of the metrics data to specify rules for scaling. Based on collected metrics data and configured alert rule conditions,
Prometheus’ Alertmanager will send an alert to trigger the desired scaling action and change the number of running managed servers in the WebLogic Server cluster.
You’ll see how to implement a custom notification integration using the
webhook receiver, a user-defined REST service that is triggered when a scaling alert event occurs. After the alert rule matches the specified conditions, the Alertmanager sends an HTTP request to the URL specified as a webhook to request the scaling action. (For more information about the webhook used in this sample demo, see this GitHub repository.)
WebLogic Server for OCI Container Engine for Kubernetes is available as a set of applications in Oracle Cloud Marketplace. You use WebLogic Server for OCI Container Engine for Kubernetes to provision a WebLogic Server domain with the WebLogic Server administration server and each managed server running in different pods in the cluster.
WebLogic Server for OCI Container Engine for Kubernetes uses Jenkins to automate the creation of custom images for a WebLogic Server domain and the deployment of these images to the cluster. WebLogic Server for OCI Container Engine for Kubernetes also creates a shared file system and mounts it to WebLogic Server pods, a Jenkins controller pod, and an admin host instance.
The application provisions a public load balancer to distribute traffic across the managed servers in your domain and a private load balancer to provide access to the WebLogic Server administration console and the
Jenkins console.
WebLogic Server for OCI Container Engine for Kubernetes also creates an
NGINX ingress controller in the cluster. NGINX is an open-source reverse proxy that controls the flow of traffic to pods within the cluster. The ingress controller is used to expose services of type Load Balancer using the load balancing capabilities of Oracle Cloud Infrastructure Load Balancing and Oracle Container Engine for Kubernetes.
Overview: How it all works
Figure 1 shows the WebLogic Server for OCI Container Engine for Kubernetes cluster components. The WebLogic Server domain consists of one administration server (AS) pod, one or more managed server (MS) pods, and the Oracle WebLogic Monitoring Exporter application deployed on the WebLogic Server cluster.
Figure 1. The cluster components
Additional components are the Prometheus pods, the Alertmanager pods, the webhook server pod, and the Oracle WebLogic Server Kubernetes Operator.
The six steps shown in Figure 1 are as follows:
- Scrape metrics from managed servers: The Prometheus server scrapes the metrics from the WebLogic Server pods. The pods are annotated to let the Prometheus server know the metrics endpoint available for scraping the WebLogic Server metrics.
- Create alert: Alertmanager evaluates the alert rules and creates an alert when an alert condition is met.
- Send alert: The alert is sent to the webhook application hook endpoint defined in the Alertmanager configuration.
- Invoke scaling action: When the webhook application’s hook is triggered, it initiates the scaling action, which is to scale up or down the WebLogic Server cluster.
- Request scale up/down: The Oracle WebLogic Server Kubernetes Operator invokes Kubernetes APIs to perform the scaling.
- Scale up/down the cluster: The cluster is scaled up or down by setting the value for the domain custom resource’s spec.clusters[].replicas parameter.
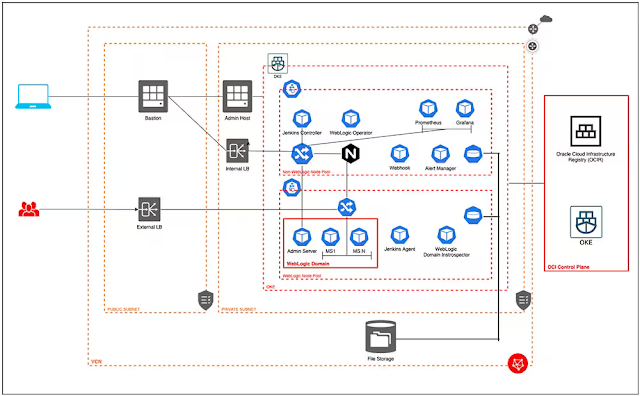
Figure 2 is a network diagram showing all the components of the WebLogic Server for OCI Container Engine for Kubernetes stack, including the admin host and bastion host provisioned with the stack. The figure also depicts the placement of different pods in the following two node pools:
◉ The WebLogic Server pods go on the WebLogic Server node pool.
◉ The Prometheus, Alertmanager, and other non-WebLogic Server pods are placed on the non-WebLogic Server node pool of the WebLogic Server for OCI Container Engine for Kubernetes stack.

Figure 2. Network diagram for the stack
There are three things you should be aware of.
- The setup for the Prometheus deployment and autoscaling will be carried out from the admin host.
- The WebLogic Server for OCI Container Engine for Kubernetes stack comes with Jenkins-based continuous integration and continuous deployment (CI/CD) to automate the creation of updated domain Docker images. The testwebapp application deployment, described below, uses Jenkins to update the domain Docker image with the testwebapp application.
- All images referenced by pods in the cluster are stored in Oracle Cloud Infrastructure Registry. The webhook application’s Docker image will be pushed to Oracle Cloud Infrastructure Registry, and the deployment of the webhook will use the image tagged as Webhook:latest from Oracle Cloud Infrastructure Registry.
Prerequisites for this project
This article builds on what was covered earlier and assumes you have already provisioned a WebLogic Server for OCI Container Engine for Kubernetes cluster through an Oracle Cloud Marketplace stack and set up Prometheus and Alertmanager. You should verify the following prerequisites are met:
- The Prometheus and Alertmanager pods are up and running in the monitoring namespace.
- The Prometheus and Alertmanager consoles are accessible via the internal load balancer’s IP address.
- The WebLogic Server metrics exposed by the Oracle WebLogic Monitoring Exporter application are available and seen from the Prometheus console.
You should also access the testwebapp that will be used for this project.
Demonstrating WebLogic Server cluster scaling in five steps
The goal here is to demonstrate the scaling action on the WebLogic Server cluster based on one of several metrics exposed by the Oracle WebLogic Monitoring Exporter application. This is done by scaling up the WebLogic Server cluster when the total open-sessions count for an application exceeds a threshold. There are several other metrics that the Oracle WebLogic Monitoring Exporter application exposes, which can be used for defining the alert rule for scaling up or scaling down the WebLogic Server cluster.
For the sake of brevity, the webhook pod is deployed on any of the node pools but, ideally, it should be deployed to the non-WebLogic Server node pool (identified by the label Jenkins) using the
nodeSelector in the pod deployment.
There are five steps required to automatically scale a WebLogic Server cluster provisioned on WebLogic Server for OCI Container Engine for Kubernetes through Oracle Cloud Marketplace when a monitored metric goes over a configured threshold. For this article, the triggering metric will be the number of open sessions for an application.
The steps are as follows:
- Deploy a testwebapp application to the WebLogic Server cluster.
- Create the Docker image for a webhook application.
- Deploy the webhook application in the cluster.
- Set up Alertmanager to send out alerts to the webhook application endpoint.
- Configure an Alertmanager rule to send out the alert when the total number of open sessions for the testwebapp across all servers in the WebLogic Server cluster exceeds a configured threshold value.
Once this work is complete, you can trigger the alert condition and then observe that the WebLogic Server cluster is properly scaled as a result.
Step 1: Deploy the testwebapp
You will start by deploying the testwebapp application to the WebLogic Server cluster.
First, create the testwebapp archive zip file that bundles the testwebapp.war file with the
Oracle WebLogic Server Deploy Toolkit deployment model YAML file. Execute the following steps from the WebLogic Server for OCI Container Engine for Kubernetes admin host instance.
cd /u01/shared
mkdir -p wlsdeploy/applications
rm -f wlsdeploy/applications/wls-exporter.war
mkdir -p model
wget https://github.com/bhabermaas/kubernetes-projects/raw/master/apps/testwebapp.war -P wlsdeploy/applications
DOMAIN_CLUSTER_NAME=$(curl -s -H "Authorization: Bearer Oracle" http://169.254.169.254/opc/v2/instance/ | jq -r '.metadata.wls_cluster_name')
cat > model/deploy-testwebapp.yaml << EOF
appDeployments:
Application:
'testwebapp' :
SourcePath: 'wlsdeploy/applications/testwebapp.war'
Target: '$DOMAIN_CLUSTER_NAME'
ModuleType: war
StagingMode: nostage
EOF
zip -r testwebapp_archive.zip wlsdeploy model
The contents of the testwebapp_archive.zip file are shown below.
[opc@wrtest12-admin shared]$ unzip -l testwebapp_archive.zip
Archive: testwebapp_archive.zip
Length Date Time Name
--------- ---------- ----- ----
0 07-27-2021 04:47 wlsdeploy/
0 08-20-2021 23:21 wlsdeploy/applications/
3550 08-20-2021 23:22 wlsdeploy/applications/testwebapp.war
0 08-20-2021 23:20 model/
190 08-20-2021 23:22 model/deploy-testwebapp.yaml
--------- -------
3740 5 files
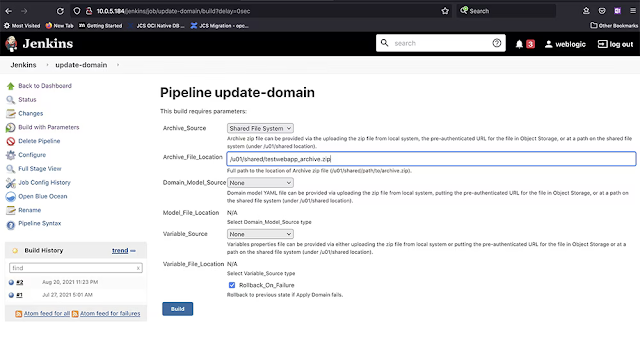
The script above creates a testwebapp_archive.zip file that can be used with WebLogic Server for OCI Container Engine for Kubernetes in an update-domain CI/CD pipeline job. Open the Jenkins console and browse to the update-domain job. Click Build with Parameters. For Archive Source, select Shared File System, and set Archive File Location to /u01/shared/testwebapp_archive.zip, as shown in Figure 3.

Figure 3. The parameters for the Jenkins pipeline update-domain build
Once the job is complete, the testwebapp application should be deployed. You can verify that it’s accessible by executing the following script on the admin host. The return code should be 200, indicating that the testwebapp is accessible via the external load balancer IP address.
INGRESS_NS=$(curl -s -H "Authorization: Bearer Oracle" http://169.254.169.254/opc/v2/instance/ | jq -r '.metadata.ingress_namespace')
SERVICE_NAME=$(curl -s -H "Authorization: Bearer Oracle" http://169.254.169.254/opc/v2/instance/ | jq -r '.metadata.service_name')
EXTERNAL_LB_IP=$(kubectl get svc "$SERVICE_NAME-external" -n $INGRESS_NS -ojsonpath="{.status.loadBalancer.ingress[0].ip}")
curl -kLs -o /dev/null -I -w "%{http_code}" https://$EXTERNAL_LB_IP/testwebapp
Step 2: Create the webhook application Docker image
The example in this article uses the webhook application, which is third-party open source code available on
GitHub. I am using webhook version 2.6.4. Here is how to create the Docker image.
Create the apps, scripts, and webhook directories, as follows:
cd /u01/shared
mkdir -p Webhook/apps
mkdir -p Webhook/scripts
mkdir -p Webhook/Webhooks
Copy the webhook executable to the apps directory.
wget -O Webhook/apps/Webhook https://github.com/bhabermaas/kubernetes-projects/raw/master/apps/Webhook
chmod +x Webhook/apps/Webhook
Download the scalingAction.sh script file into the scripts directory, as follows:
wget https://raw.githubusercontent.com/oracle/Oracle WebLogic-kubernetes-operator/main/operator/scripts/scaling/scalingAction.sh -P Webhook/scripts
Create scaleUpAction.sh in the scripts directory.
DOMAIN_NS=$(curl -s -H "Authorization: Bearer Oracle" http://169.254.169.254/opc/v2/instance/ | jq -r '.metadata.wls_domain_namespace')
DOMAIN_UID=$(curl -s -H "Authorization: Bearer Oracle" http://169.254.169.254/opc/v2/instance/ | jq -r '.metadata.wls_domain_uid')
OPERATOR_NS=$(curl -s -H "Authorization: Bearer Oracle" http://169.254.169.254/opc/v2/instance/ | jq -r '.metadata.wls_operator_namespace')
SERVICE_NAME=$(curl -s -H "Authorization: Bearer Oracle" http://169.254.169.254/opc/v2/instance/ | jq -r '.metadata.service_name')
CLUSTER_NAME=$(curl -s -H "Authorization: Bearer Oracle" http://169.254.169.254/opc/v2/instance/ | jq -r '.metadata.wls_cluster_name')
cat > Webhook/scripts/scaleUpAction.sh << EOF
#!/bin/bash
echo scale up action >> scaleup.log
MASTER=https://\$KUBERNETES_SERVICE_HOST:\$KUBERNETES_PORT_443_TCP_PORT
echo Kubernetes master is \$MASTER
source /var/scripts/scalingAction.sh --action=scaleUp --domain_uid=$DOMAIN_UID --cluster_name=$CLUSTER_NAME --kubernetes_master=\$MASTER --wls_domain_namespace=$DOMAIN_NS --operator_namespace=$OPERATOR_NS --operator_service_name=internal-Oracle WebLogic-operator-svc --operator_service_account=$SERVICE_NAME-operator-sa
EOF
chmod +x Webhook/scripts/*
Similar to the script listed above, you can create a scaleDownAction.sh script by passing the --action=scaleDown parameter to the scalingAction.sh script.
Create Dockerfile.Webhook for the webhook application, as follows. Note that the code below uses an http endpoint for the webhook application. To have the application serve hooks over HTTPS (which would obviously be more secure in a real deployment, but more complex for this example), see the
webhook app documentation.
cat > Webhook/Dockerfile.Webhook << EOF
FROM store/oracle/serverjre:8
COPY apps/Webhook /bin/Webhook
COPY Webhooks/hooks.json /etc/Webhook/
COPY scripts/scaleUpAction.sh /var/scripts/
COPY scripts/scalingAction.sh /var/scripts/
RUN chmod +x /var/scripts/*.sh
CMD ["-verbose", "-hooks=/etc/Webhook/hooks.json", "-hotreload"]
ENTRYPOINT ["/bin/Webhook"]
EOF
Create the hooks.json file in the Webhooks directory. Similar to scaleup, you can define a hook for scaledown that invokes the scaleDownAction.sh script.
cat > Webhook/Webhooks/hooks.json << EOF
[
{
"id": "scaleup",
"execute-command": "/var/scripts/scaleUpAction.sh",
"command-working-directory": "/var/scripts",
"response-message": "scale-up call ok\n"
}
]
EOF
Build the webhook Docker image tagged as Webhook:latest and push it to the Oracle Cloud Infrastructure Registry repository. Use Docker hub credentials to log in to the Docker hub before doing a Docker build.
cd Webhook
OCIR_URL=$(curl -s -H "Authorization: Bearer Oracle" http://169.254.169.254/opc/v2/instance/ | jq -r '.metadata.ocir_url')
OCIR_USER=$(curl -s -H "Authorization: Bearer Oracle" http://169.254.169.254/opc/v2/instance/ | jq -r '.metadata.ocir_user')
OCIR_PASSWORD_OCID=$(curl -s -H "Authorization: Bearer Oracle" http://169.254.169.254/opc/v2/instance/ | jq -r '.metadata.ocir_password')
OCIR_PASSWORD=$(python /u01/scripts/utils/oci_api_utils.py get_secret $OCIR_PASSWORD_OCID)
OCIR_NS=$(curl -s -H "Authorization: Bearer Oracle" http://169.254.169.254/opc/v2/instance/ | jq -r '.metadata.ocir_namespace')
docker image rm Webhook:latest
docker login -u <docker hub="" user=""> -p <docker hub="" password="">
docker build -t Webhook:latest -f Dockerfile.Webhook .
docker image tag Webhook:latest $OCIR_URL/$OCIR_NS/Webhook
docker login $OCIR_URL -u $OCIR_USER -p "$OCIR_PASSWORD"
docker image push $OCIR_URL/$OCIR_NS/Webhook
</docker></docker>
Step 3: Deploy the webhook application into the WebLogic Server OCI Container Engine for Kubernetes cluster
Now that the webhook application Docker image has been pushed out to Oracle Cloud Infrastructure Registry, you can update the Webhook-deployment.yaml file to use that image.
Start by creating the ocirsecrets secret file in the monitoring namespace for the webhook deployment. It will be able to pull the Webhook:latest image from Oracle Cloud Infrastructure Registry
OCIR_URL=$(curl -s -H "Authorization: Bearer Oracle" http://169.254.169.254/opc/v2/instance/ | jq -r '.metadata.ocir_url')
OCIR_USER=$(curl -s -H "Authorization: Bearer Oracle" http://169.254.169.254/opc/v2/instance/ | jq -r '.metadata.ocir_user')
OCIR_PASSWORD_OCID=$(curl -s -H "Authorization: Bearer Oracle" http://169.254.169.254/opc/v2/instance/ | jq -r '.metadata.ocir_password')
OCIR_PASSWORD=$(python /u01/scripts/utils/oci_api_utils.py get_secret $OCIR_PASSWORD_OCID)
kubectl create secret docker-registry ocirsecrets --docker-server="$OCIR_URL" --docker-username="$OCIR_USER" --docker-password="$OCIR_PASSWORD" -n monitoring
Run the following script, which downloads the Webhook-deployment.yaml file and updates it with imagePullSecrets.
cd /u01/shared
wget https://raw.githubusercontent.com/bhabermaas/kubernetes-projects/master/kubernetes/Webhook-deployment.yaml -P prometheus
OCIR_URL=$(curl -s -H "Authorization: Bearer Oracle" http://169.254.169.254/opc/v2/instance/ | jq -r '.metadata.ocir_url')
OCIR_NS=$(curl -s -H "Authorization: Bearer Oracle" http://169.254.169.254/opc/v2/instance/ | jq -r '.metadata.ocir_namespace')
OPERATOR_NS=$(curl -s -H "Authorization: Bearer Oracle" http://169.254.169.254/opc/v2/instance/ | jq -r '.metadata.wls_operator_namespace')
INTERNAL_OPERATOR_CERT_VAL=$(kubectl get configmap Oracle WebLogic-operator-cm -n $OPERATOR_NS -o jsonpath='{.data.internalOperatorCert}')
sed -i "s/extensions\/v1beta1/apps\/v1/g" prometheus/Webhook-deployment.yaml
sed -i "s/verbs: \[\"get\", \"list\", \"watch\", \"update\"\]/verbs: \[\"get\", \"list\", \"watch\", \"update\", \"patch\"\]/g" prometheus/Webhook-deployment.yaml
sed -i "s/image: Webhook:latest/image: $OCIR_URL\/$OCIR_NS\/Webhook:latest/g" prometheus/Webhook-deployment.yaml
sed -i "s/imagePullPolicy: .*$/imagePullPolicy: Always/g" prometheus/Webhook-deployment.yaml
sed -i "s/value: LS0t.*$/value: $INTERNAL_OPERATOR_CERT_VAL/g" prometheus/Webhook-deployment.yaml
sed -i "85 i \ \ \ \ \ \ imagePullSecrets:" prometheus/Webhook-deployment.yaml
sed -i "86 i \ \ \ \ \ \ \ \ - name: ocirsecrets" prometheus/Webhook-deployment.yaml
To help you see what the script above did, here’s a sample updated Webhook-deployment.yaml file.
apiVersion: rbac.authorization.k8s.io/v1beta1
kind: ClusterRole
metadata:
name: Webhook
rules:
- apiGroups: [""]
resources:
- nodes
- namespaces
- nodes/proxy
- services
- endpoints
- pods
- services/status
verbs: ["get", "list", "watch"]
- apiGroups:
- extensions
resources:
- ingresses
verbs: ["get", "list", "watch"]
- apiGroups: ["Oracle WebLogic.oracle"]
resources: ["domains"]
verbs: ["get", "list", "watch", "update", "patch"]
---
apiVersion: v1
kind: ServiceAccount
metadata:
name: default
namespace: monitoring
---
apiVersion: rbac.authorization.k8s.io/v1beta1
kind: ClusterRoleBinding
metadata:
name: Webhook
roleRef:
apiGroup: rbac.authorization.k8s.io
kind: ClusterRole
name: Webhook
subjects:
- kind: ServiceAccount
name: default
name: default
namespace: monitoring
---
apiVersion: apps/v1
kind: Deployment
metadata:
labels:
name: Webhook
name: Webhook
namespace: monitoring
spec:
replicas: 1
selector:
matchLabels:
name: Webhook
template:
metadata:
creationTimestamp: null
labels:
name: Webhook
spec:
containers:
- image: iad.ocir.io/idiaaaawa6h/Webhook:latest
imagePullPolicy: Always
name: Webhook
env:
- name: INTERNAL_OPERATOR_CERT
value: LS0tLS1CRUdJTiBDRVJUSUZJQ0FUR...NBVEUtLS0tLQo=
ports:
- containerPort: 9000
protocol: TCP
resources:
limits:
cpu: 500m
memory: 2500Mi
requests:
cpu: 100m
memory: 100Mi
restartPolicy: Always
securityContext: {}
terminationGracePeriodSeconds: 30
imagePullSecrets:
- name: ocirsecrets
---
apiVersion: v1
kind: Service
metadata:
name: Webhook
namespace: monitoring
spec:
selector:
name: Webhook
type: ClusterIP
ports:
- port: 9000
Now you can deploy the webhook.
kubectl apply -f prometheus/Webhook-deployment.yaml
while [[ $(kubectl get pods -n monitoring -l name=Webhook -o 'jsonpath={..status.conditions[?(@.type=="Ready")].status}') != "True" ]]; do echo "waiting for pod" && sleep 1; done
Verify that all resources are running in the monitoring namespace.
[opc@wrtest12-admin shared]$ kubectl get all -n monitoring
NAME READY STATUS RESTARTS AGE
pod/grafana-5b475466f7-hfr4v 1/1 Running 0 17d
pod/prometheus-alertmanager-5c8db4466d-trpnt 2/2 Running 0 46h
pod/prometheus-kube-state-metrics-86dc6bb59f-6cfnd 1/1 Running 0 46h
pod/prometheus-node-exporter-cgtnd 1/1 Running 0 46h
pod/prometheus-node-exporter-fg9m8 1/1 Running 0 46h
pod/prometheus-server-649d869bd4-swxmk 2/2 Running 0 46h
pod/Webhook-858cb4b794-mwfqp 1/1 Running 0 8h
NAME TYPE CLUSTER-IP EXTERNAL-IP PORT(S) AGE
service/grafana ClusterIP 10.96.106.93 <none> 80/TCP 17d
service/prometheus-alertmanager NodePort 10.96.172.217 <none> 80:32000/TCP 46h
service/prometheus-kube-state-metrics ClusterIP 10.96.193.169 <none> 8080/TCP 46h
service/prometheus-node-exporter ClusterIP None <none> 9100/TCP 46h
service/prometheus-server NodePort 10.96.214.99 <none> 80:30000/TCP 46h
service/Webhook ClusterIP 10.96.238.121 <none> 9000/TCP 8h
NAME DESIRED CURRENT READY UP-TO-DATE AVAILABLE NODE SELECTOR AGE
daemonset.apps/prometheus-node-exporter 2 2 2 2 2 <none> 46h
NAME READY UP-TO-DATE AVAILABLE AGE
deployment.apps/grafana 1/1 1 1 17d
deployment.apps/prometheus-alertmanager 1/1 1 1 46h
deployment.apps/prometheus-kube-state-metrics 1/1 1 1 46h
deployment.apps/prometheus-server 1/1 1 1 46h
deployment.apps/Webhook 1/1 1 1 8h
NAME DESIRED CURRENT READY AGE
replicaset.apps/grafana-5b475466f7 1 1 1 17d
replicaset.apps/prometheus-alertmanager-5c8db4466d 1 1 1 46h
replicaset.apps/prometheus-kube-state-metrics-86dc6bb59f 1 1 1 46h
replicaset.apps/prometheus-server-649d869bd4 1 1 1 46h
replicaset.apps/Webhook-858cb4b794 1 1 1 8h
</none></none></none></none></none></none></none>
Step 4: Configuring Alertmanager
It’s time to set up Alertmanager to send out alerts to the webhook application endpoint. The trigger rules for those alerts will be configured in Step 5.
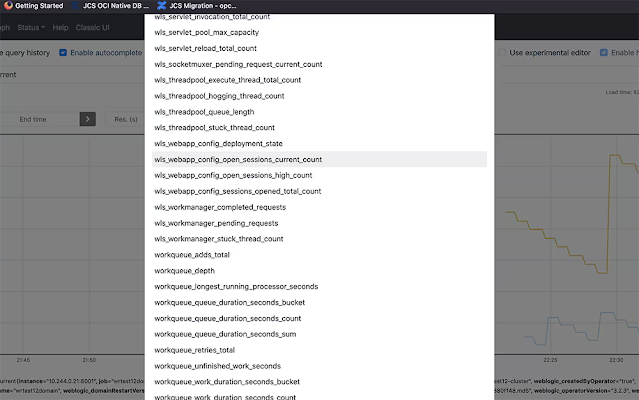
You should verify that the metric wls_webapp_config_open_sessions_current_count is listed in the drop-down list that shows all the metrics in the Prometheus console. This is the metric that will be used in the alert rule. Browse to the Prometheus console and click Open Metrics Explorer to verify the metric wls_webapp_config_open_sessions_current_count is available, as shown in Figure 4.

Figure 4. Verifying the metric is listed in the Prometheus console
The expression sum(wls_webapp_config_open_sessions_current_count{app="testwebapp"}) > 15 checks for open sessions for the testwebapp across all managed servers. For example, if the value of the open-sessions count on managed server 1 for testwebapp is 10 and on managed server 2 it is 8, the total open-sessions count will be 18. In that case, the alert will be fired.
Verify the expression and the current value of the metric from the Prometheus console, as shown in Figure 5.
Figure 5. Verifying the expression and current value of the trigger metric
Configure Alertmanager to invoke the webhook when an alert is received. To do this, edit the prometheus-alertmanager configmap file, as shown below. The script also changes the URL from http://Webhook.Webhook.svc.cluster.local:8080/log to http://Webhook:9000/hooks/scaleup, and it changes the receiver name from logging-Webhook to web.hook.
kubectl get configmap prometheus-alertmanager -n monitoring -o yaml > prometheus/prometheus-alertmanager-cm.yaml
sed -i "s/name: logging-Webhook/name: web.hook/g" prometheus/prometheus-alertmanager-cm.yaml
sed -i "s/receiver: logging-Webhook/receiver: web.hook/g" prometheus/prometheus-alertmanager-cm.yaml
sed -i "s/url: .*$/url: http:\/\/Webhook:9000\/hooks\/scaleup/g" prometheus/prometheus-alertmanager-cm.yaml
kubectl apply -f prometheus/prometheus-alertmanager-cm.yaml
Step 5: Update the Alertmanager rule
Here is how to update the Prometheus Alertmanager rule to send the alert when the total number of open sessions for the testwebapp across all servers in the WebLogic Server cluster exceeds the configured threshold value of 15.
kubectl get configmap prometheus-server -n monitoring -o yaml > prometheus/prometheus-server-cm.yaml
sed -i "18 i \ \ \ \ \ \ - alert: ScaleUp" prometheus/prometheus-server-cm.yaml
sed -i "19 i \ \ \ \ \ \ \ \ annotations:" prometheus/prometheus-server-cm.yaml
sed -i "20 i \ \ \ \ \ \ \ \ \ \ description: Firing when total sessions active greater than 15" prometheus/prometheus-server-cm.yaml
sed -i "21 i \ \ \ \ \ \ \ \ \ \ summary: Scale up when current sessions is greater than 15" prometheus/prometheus-server-cm.yaml
sed -i "22 i \ \ \ \ \ \ \ \ expr: sum(wls_webapp_config_open_sessions_current_count{app=\"testwebapp\"}) > 15" prometheus/prometheus-server-cm.yaml
sed -i "23 i \ \ \ \ \ \ \ \ for: 1m" prometheus/prometheus-server-cm.yaml
kubectl apply -f prometheus/prometheus-server-cm.yaml
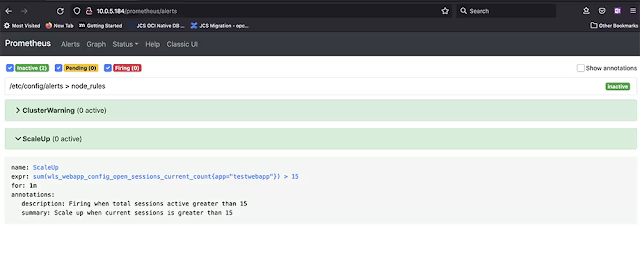
Verify the alert rule shows up in the Prometheus alerts screen, as shown in Figure 6. Be patient: It may take a couple of minutes for the rule to show up.

Figure 6. Verifying that the alert rule appears in Prometheus
See if everything works
All the pieces are in place to autoscale the WebLogic Server cluster. To see if autoscaling works, create an alert by opening more than the configured 15 sessions of the testwebapp application. You can do that by using the following script to create 17 sessions using curl from the WebLogic Server for OCI Container Engine for Kubernetes admin host.
cat > max_sessions.sh << EOF
#!/bin/bash
COUNTER=0
MAXCURL=17
while [ \$COUNTER -lt \$MAXCURL ]; do
curl -kLs -o /dev/null -I -w "%{http_code}" https://\$1/testwebapp
let COUNTER=COUNTER+1
sleep 1
done
EOF
chmod +x max_sessions.sh
Next, run this script from the admin host.
INGRESS_NS=$(curl -s -H "Authorization: Bearer Oracle" http://169.254.169.254/opc/v2/instance/ | jq -r '.metadata.ingress_namespace')
SERVICE_NAME=$(curl -s -H "Authorization: Bearer Oracle" http://169.254.169.254/opc/v2/instance/ | jq -r '.metadata.service_name')
EXTERNAL_LB_IP=$(kubectl get svc "$SERVICE_NAME-external" -n $INGRESS_NS -ojsonpath="{.status.loadBalancer.ingress[0].ip}")
echo $EXTERNAL_LB_IP
./max_sessions.sh $EXTERNAL_LB_IP
You can verify the current value for the open-sessions metric again in the Prometheus console. The sum of the values across all managed servers should show at least 17, as shown in Figure 7.

Figure 7. Verifying the number of open testwebapp sessions
After that, verify the ScaleUp alert is in the firing state (the state will change from inactive to pending to firing), as shown in Figure 8. It may take couple moments to change states.
Figure 8. Confirming the ScaleUp alert is firing
Once the alert has fired, the automatic scaling of the WebLogic Server cluster should be triggered via the webhook. You can verify that scaling has been triggered by looking into the webhook pod’s logs and by looking at the number of managed server pods in the domain namespace.
First, verify the webhook pod’s log, as shown below, to see if the scaling was triggered and handled without issue.
[opc@wrtest12-admin shared]$ kubectl logs Webhook-858cb4b794-mwfqp -n monitoring
[Webhook] 2021/08/23 18:41:46 version 2.6.4 starting
[Webhook] 2021/08/23 18:41:46 setting up os signal watcher
[Webhook] 2021/08/23 18:41:46 attempting to load hooks from /etc/Webhook/hooks.json
[Webhook] 2021/08/23 18:41:46 os signal watcher ready
[Webhook] 2021/08/23 18:41:46 found 1 hook(s) in file
[Webhook] 2021/08/23 18:41:46 loaded: scaleup
[Webhook] 2021/08/23 18:41:46 setting up file watcher for /etc/Webhook/hooks.json
[Webhook] 2021/08/23 18:41:46 serving hooks on http://0.0.0.0:9000/hooks/{id}
[Webhook] 2021/08/23 18:53:29 incoming HTTP request from 10.244.0.68:49284
[Webhook] 2021/08/23 18:53:29 scaleup got matched
[Webhook] 2021/08/23 18:53:29 scaleup hook triggered successfully
[Webhook] 2021/08/23 18:53:29 2021-08-23T18:53:29Z | 200 | 725.833µs | Webhook:9000 | POST /hooks/scaleup
[Webhook] 2021/08/23 18:53:29 executing /var/scripts/scaleUpAction.sh (/var/scripts/scaleUpAction.sh) with arguments ["/var/scripts/scaleUpAction.sh"] and environment [] using /var/scripts as cwd
[Webhook] 2021/08/23 18:53:30 command output: Kubernetes master is https://10.96.0.1:443
[Webhook] 2021/08/23 18:53:30 finished handling scaleup
[Webhook] 2021/08/23 19:49:19 incoming HTTP request from 10.244.0.68:60516
[Webhook] 2021/08/23 19:49:19 scaleup got matched
[Webhook] 2021/08/23 19:49:19 scaleup hook triggered successfully
[Webhook] 2021/08/23 19:49:19 2021-08-23T19:49:19Z | 200 | 607.125µs | Webhook:9000 | POST /hooks/scaleup
[Webhook] 2021/08/23 19:49:19 executing /var/scripts/scaleUpAction.sh (/var/scripts/scaleUpAction.sh) with arguments ["/var/scripts/scaleUpAction.sh"] and environment [] using /var/scripts as cwd
[Webhook] 2021/08/23 19:49:21 command output: Kubernetes master is https://10.96.0.1:443
[Webhook] 2021/08/23 19:49:21 finished handling scaleup
And verify that the managed server count has changed from 2 to 3.
[opc@wrtest12-admin shared]$ kubectl get po -n wrtest12-domain-ns
NAME READY STATUS RESTARTS AGE
wrtest12domain-wrtest12-adminserver 1/1 Running 0 29h
wrtest12domain-wrtest12-managed-server1 1/1 Running 0 29h
wrtest12domain-wrtest12-managed-server2 1/1 Running 0 5m22s
wrtest12domain-wrtest12-managed-server3 1/1 Running 0 92s
Source: oracle.com
