Wednesday, July 27, 2022

Advanced topics for using the Constrained Application Protocol (CoAP)

Use CoAP and the Observer design pattern to work with IoT devices.

The first article in this series on the Constrained Application Protocol (CoAP) covered the basics and explored how to add CoAP messaging in your own Java applications. This article concludes the discussion by exploring advanced topics such as the Observer design pattern, device discovery, and cross-protocol proxies.

CoAP meets the Observer pattern


CoAP, a basic REST-like request/response protocol, facilitates extensions. One example is the CoAP extension for observing resources via the Observer pattern.

To register interest in updates to a resource without polling for it continually, the CoAP client simply adds an OBSERVE entry in the request header with a value of 0. The Observer extension to CoAP supports confirmable and nonconfirmable registrations for resource updates. The sequence diagram in Figure 1 is a sample confirmable (CON) observer registration request with updates.

Core Java, Java Exam Prep, Java Materials, Oracle Java Certification, Oracle Java Tutorial and Materials, Oracle Java Preparation

Figure 1. A CON request with observer registration

First, client 1 makes a request to client 2 with the OBSERVE option in the header set to 0. This indicates a registration request. Client 2 sends an update with current data, echoing the token client 1 sent with the request, and it continues to use this token with each update. Since the request was a CON message, each response with data requires an ACK.

As time passes and the observed value changes, client 2 sends the new value in an updated CON response. Again, these updates contain the same token as the initial request, and client 1 must send an ACK. If an ACK is not sent, client 2 deregisters client 1 after the timeout period.

With the Californium CoAP library on the server side, the observation is implemented by marking the resource as observable, as shown in Listing 1.

Listing 1.  Marking a CoAP server resource as observable

public class CoapObserveServer extends CoapResource {
  // ...
  public CoapObserveServer(String name) {
    super(name);
    // enable observations and set type to CONS
    setObservable(true);
    setObserveType(Type.CON);

    // mark observable in the Link-Format
    getAttributes().setObservable();

    // schedule a periodic update timer
    // alternatively, call changed() as needed
    new Timer().schedule(new UpdateTask(), 0, 1000);
   }

For a client application, setting up the Observer pattern is like an asynchronous resource request (see Listing 2). You can download the complete client application from my GitHub repository.

Listing 2. Implementing the CoAP Observer pattern

class AsynchListener implements CoapHandler {
   @Override
   public void onLoad(CoapResponse response) {
       System.out.println( response.getResponseText() );
   }
@Override
   public void onError() { /*...*/ }
}
//...
CoapClient client =
   new CoapClient("coap://10.0.1.97:5683/temp");

// observer pattern uses asynchronous listener
AsynchListener asynchListener =
   new AsynchListener();

CoapObserveRelation observation =
   client.observe(asynchListener);
// ...
observation.proactiveCancel();

As with an asynchronous GET request, the first step is to supply a callback in the call to CoapClient.observe(). From that point onward, the callback receives updates as the data changes (such as measured temperature changes), according to the server resource.

On the server, calling the CoapResource.changed() method causes this CoAP server to automatically send a subsequent response (a temperature update) to the initial GET request for data on the observable resource, as shown in Listing 3.

Listing 3. Periodic updates cause a GET response to be sent to all observers.

private class UpdateTask extends TimerTask {
   @Override
   public void run() {
       changed(); // notify all observers
   }
}
@Override
public void handleGET(CoapExchange exchange) {
   // the Max-Age value should match the update interval
   exchange.setMaxAge(1);
   exchange.respond("Current temperature: " +
                    getCurrentTemp() );
}

For each active observer, the onload method is called, and the latest data value (temperature, in this example) is sent in the response. As shown at the end of Listing 2, you can cancel the observation and stop the updates by calling CoapObserveRelation.proactiveCancel(). This method sends a RESET message to the server in response to the next update. The server then removes this client from the list of observers for the associated resource.

Device discovery using CoAP


CoAP supports dynamic device discovery, which is useful in an Internet of Things (IoT) environment of changing networks of devices and sensors. To discover another CoAP server, the client is required to either know about the resource ahead of time or to support multicast CoAP via User Datagram Protocol (UDP) messaging on a multicast address and port. Servers that wish to be discoverable must listen and reply to requests on the “all CoAP nodes” multicast address to let other clients or servers know of its existence and addressable URI.

The multicast “all CoAP nodes” address is 224.0.1.187 for IPv4 and FF05::FD for IPv6. Sending a request for the CoAP resource directory name /.well-known/core should result in a reply from every reachable CoAP resource on the local network segment listening on the multicast address (see Listing 4).

Listing 4.  Listening for “all CoAP nodes” multicast requests

CoapServer server = ...
InetAddress addr = InetAddress.getByName("224.0.1.187");
bindToAddress = new InetSocketAddress(addr, COAP_PORT);
CoapEndpoint multicast = 
    CoapEndpoint.builder()
        .setInetSocketAddress(bindToAddress)
        .setPort(5683)
        .build();
server.addEndpoint(multicast);

In Listing 4, the multicast address is set as a CoapEndpoint to the Californium CoapServer object. You can create a CoAP GET request to discover CoAP servers and their resources, as shown in Listing 5, this time using the IPv6 multicast address.

Listing 5. A CoAP GET request to discover CoAP servers and resources on a local network

CoapClient client =
   new CoapClient("coap://FF05::FD:5683/.well-known/core");
client.useNONs();
CoapResponse response = client.get();
if ( response != null ) {
   // get server's IP address
   InetSocketAddress addr = 
       response.advanced()
           .getSourceContext()
           .getPeerAddress();
   int port = addr.getPort();
   System.out.println("Source address: " +
                       addr + ":" + port);
}

Note that the request must be a NON GET request, hence the call to client.useNONs() in the second line. Additionally, making a request to the base URI coap://FF05::FD:5683 yields basic information about the server, such as the resources and associated URIs it supports.

Dynamic resource discovery is useful when you’re building a dynamic IoT application; in that case, it’s not desired to hardcode or manually configure available CoAP servers and their resources.

For instance, if you have a single controller application that allows all lights (or other appliances) within a room or building floor to be turned off and on together, you can use a resource discovery to locate all available smart lighting devices. Using the results of the discovery, you can send CoAP commands to each smart lighting device to turn off and on, as appropriate. If new lighting devices are added at some future date, the controller code continues to work on all lighting devices with no change needed.

The CoAP resource directory


To better enable resource discovery for constrained devices — that is, some devices that are sleeping or noncommunicative at times — a CoAP resource directory was defined. This entity maintains descriptions of CoAP servers and resources within your distributed application. Specifically, devices can register themselves as servers, along with their resources, in a well-known resource directory node.

CoAP client applications can subsequently refer to the resource directory to learn about resources as they become available and then become part of the distributed application.

CoAP endpoints register themselves with the resource directory via its registration interface (see Figure 2). CoAP client applications then use the lookup or CoAP group interfaces  (more on groups in the next sections)  to learn about available resources.

Core Java, Java Exam Prep, Java Materials, Oracle Java Certification, Oracle Java Tutorial and Materials, Oracle Java Preparation

Figure 2. The CoAP resource directory interfaces

Endpoints register their resources by sending a POST request with the resource path (such as /temp), the endpoint name, and optional data such as a domain, the endpoint type, and other data. If the POST request is successful, the response code is 2.01, and a resource identifier is returned (such as /rd/1234). This identifier can be used to access the CoAP resource through the resource directory server. For example, the code in Listing 6 registers a pulse oximeter’s heart rate and oxygen saturation telemetry resources.

Listing 6. The client code to register CoAP endpoint resources with a resource directory server

String host = "coap://10.0.1.111/";
CoapClient rd;
System.out.println("Registering resource: heart rate ");
rd = new CoapClient(host+"rd?ep=pulseoximeter/heartrate/");
resp = rd.post("</pulseoximeter/heartrate>;"
               + "ct=41;rt=\"Heartrate Resource\";"
               + "if=\"sensor\"",
              MediaTypeRegistry.APPLICATION_LINK_FORMAT);
System.out.println("--Response: " +
                  resp.getCode() + ", " +
                  resp.getOptions().getLocationString());
System.out.println("Registering resource: oxygen-saturation ");
rd = new CoapClient(host+"rd?ep=pulseoximeter/oxygen-saturation/");
resp = rd.post("</pulseoximeter/oxygen-saturation>;"
               + "ct=41;rt=\"Oxygen Saturation Resource\";"
               + "if=\"sensor\"",
              MediaTypeRegistry.APPLICATION_LINK_FORMAT);
System.out.println("--Response: " +
                  resp.getCode() + ", " +
                  resp.getOptions().getLocationString());

First, the code connects to a CoAP resource directory server running on node 10.0.1.111 (an arbitrary address for this example). It connects using a resource endpoint name of /pulseoximeter/heartrate because that’s the resource it registers first. Next, a POST request is made using that endpoint, a URI path of /pulseoximeter/heartrate, a name of Heartrate Resource, and an endpoint type sensor. The same is done for the other resource, /pulseoximeter/oxygen-saturation. When this is executed successfully, you should see output like Listing 7.

Listing 7.  The result of a successful resource registration

Registering resource: heartrate
--Response: 2.01, /rd/pulseoximeter/heartrate
Registering resource: oxygen-saturation
--Response: 2.01, /rd/pulseoximeter/oxygen-saturation

To further illustrate the results of registration, Listing 8 adds code to make a resource discovery request to the resource directory server.

Listing 8. Sending a resource discovery request to the resource directory server

CoapClient q = new CoapClient("coap://10.0.1.111/.well-known/core");
CoapResponse resp = q.get();
System.out.println( "--Registered resources: " +
                   resp.getResponseText());

Adding this code both before the endpoint registration requests and after yields the complete set of output shown in Listing 9.

Listing 9. The results of endpoint registration

--Registered resources: </rd>;rt="core.rd",</rd-lookup>;rt="core.rd-lookup",</rd-lookup/d>,</rd-lookup/ep>,</rd-lookup/res>,</.well-known/core>,</tags>
Registering resource: heartrate
--Response: 2.01, /rd/pulseoximeter/heartrate
Registering resource: oxygen-saturation
--Response: 2.01, /rd/pulseoximeter/oxygen-saturation
--Registered resources: </rd>;rt="core.rd",</rd/pulseoximeter/heartrate/>,</rd/pulseoximeter/oxygen-saturation/>,</rd-lookup>;rt="core.rd-lookup",</rd-lookup/d>,</rd-lookup/ep>,</rd-lookup/res>,</.well-known/core>,</tags>

Note that the result from the resource discovery request, made after the endpoint registration POST requests, now includes the two added pulse oximeter endpoint resources, as expected.

CoAP resource group definitions


To further enable CoAP device group communication, the CoAP CoRE Working Group defined the “Group Communication for the Constrained Application Protocol” specification (RFC 7390). (CoRE stands for constrained RESTful environments.) This specification outlines methods to define and subsequently communicate with groups of devices.

For instance, for a CoAP server that supports RFC 7390, a POST request to the resource /coap-group with a group name and index provided as form data would create a new CoAP resource group. An example is shown in Listing 10.

Listing 10.  CoAP resource group creation as a POST message

POST /coap-group
Content-Format: application/coap-group+json
{
 "n": "lights.floor1.example.com",
 "a": "[ff15::4200:f7fe:ed37:abcd]:1234"
}

If the action is successful, the response is like that shown in Listing 11.

Listing 11. The response for a POST request to create a new CoAP resource group

2.01 Created
Location-Path: /coap-group/12

Sending a GET request to /coap-group returns JSON data indicating all members of the group. A sample response is shown in Listing 12.

Listing 12. A CoAP GET response for a CoAP group request

2.05 Content
Content-Format: application/coap-group+json
{
   "8" : { "a": "[ff15::4200:f7fe:ed37:14ca]" },
   "11": { "n": "sensors.floor1.example.com",
           "a": "[ff15::4200:f7fe:ed37:25cb]" },
   "12": { "n": "lights.floor1.example.com",
           "a": "[ff15::4200:f7fe:ed37:abcd]:1234" }
}

Subsequently, you can make requests to a specific group, such as /coap-group/12, to control or read the status of the devices within that group as a whole.

Cross-protocol proxying (CoAP and HTTP)


Because CoAP is a REST-based protocol based on the underlying HTTP implementation, it’s straightforward to map CoAP methods to HTTP. As such, it’s straightforward to proxy CoAP requests to and from HTTP so CoAP clients can access resources available on an HTTP server or allow HTTP clients (such as JavaScript code) to make requests to CoAP servers.

For example, the code in Listing 13 is from the Californium sample code and shows how to implement a simple CoAP-to-CoAP and CoAP-to-HTTP proxy.

Listing 13. A simple CoAP-to-HTTP proxy from the Californium sample applications

private static class TargetResource extends CoapResource {
   private int counter = 0;
   public TargetResource(String name) {
       super(name);
   }
   @Override
   public void handleGET(CoapExchange exchange) {
       exchange.respond(
           "Response " + (++counter) +
           " from resource " + getName() );
   }
}
public coap_cross_proxy() throws IOException {
   ForwardingResource coap2coap =
       new ProxyCoapClientResource("coap2coap");
   ForwardingResource coap2http =
       new ProxyHttpClientResource("coap2http");
   // Create CoAP Server with proxy resources
   // from CoAP to CoAP and HTTP
   targetServerA = new CoapServer(8082);
   targetServerA.add(coap2coap);
   targetServerA.add(coap2http);
   targetServerA.start();
   ProxyHttpServer httpServer =
       new ProxyHttpServer(8080);
   httpServer.setProxyCoapResolver(
       new DirectProxyCoapResolver(coap2coap) );
   System.out.println(
       "CoAP resource \"target\" available over HTTP at: " +
       "http://localhost:8080/proxy/coap://localhost:PORT/target");
}

Running a resource named helloWorld as coap://localhost:5683/helloWorld and browsing to the proxy URL, as specified in the code, results in the payload being displayed in the browser; see Figure 3.

Core Java, Java Exam Prep, Java Materials, Oracle Java Certification, Oracle Java Tutorial and Materials, Oracle Java Preparation

Figure 3. The result of a CoAP-to-HTTP proxy, with the response text displayed in the browser

By the way, CoAP can be proxied to other protocols, such as the Session Initiation Protocol (SIP) and the Extensible Messaging and Presence Protocol (XMPP).

The Californium CoAP implementation and cf-browser


The Eclipse Californium project provides an open source CoAP implementation you can use to enable CoAP communication in your applications. The project can be downloaded from the GitHub repository.

You need Maven to build and install Californium. To use Maven, set your JAVA_HOME and M2_HOME environment variables, and then run the following Maven command:

> mvn clean install -DskipTests

You can include Californium in your projects by adding the following to your Maven pom.xml file:

<dependency>
    <groupId>org.eclipse.californium</groupId>
    <artifactId>californium-core</artifactId>
    <version>3.5.0</version>
</dependency>

Californium comes with a set of tools to help you code and debug CoAP applications. One of the most useful is a JavaFX-based browser, cf-browser, that you can use to visually discover, explore, and interact with CoAP devices on your network. It’s a useful tool that I recommend for learning and debugging CoAP endpoint programming.

First, clone the GitHub repository:

> git clone https://github.com/eclipse/californium.tools.git

Next, install OpenJFX. For Windows, download the binary from OpenJFX. For Linux, install it with Aptitude using the following command:

> sudo apt install openjfx

Next, within the californium.tools directory, build the tools with the following command:

> mvn clean install

To run the CoAP browser change into the cf-browser directory, and run the following command:

> mv javafx:run

Once cf-browser is installed and running, browse to the address of a CoAP node on your network. For instance, Figure 4 shows the result of typing coap://localhost:5683 into the Target address textbox and then clicking the DISCOVERY button in the upper right.

Core Java, Java Exam Prep, Java Materials, Oracle Java Certification, Oracle Java Tutorial and Materials, Oracle Java Preparation

Figure 4. The cf-browser tool visually displays and interacts with CoAP instances.

You can interact with the tool by discovering the resources available on your network and sending data to resources you select via the buttons labeled GET, POST, and so on. You can even receive continuous CoAP updates for observable resources by selecting the OBSERVE button. The resulting data is displayed in the Response section, as shown in Figure 5.

Core Java, Java Exam Prep, Java Materials, Oracle Java Certification, Oracle Java Tutorial and Materials, Oracle Java Preparation

Figure 5. Interacting with CoAP resources to discover and debug them with cf-browser

Other tools included with Californium are a command-line client (cf-client) you can use to easily listen on CoAP resources and a standalone CoAP server.

Source: oracle.com

Friday, July 22, 2022

BYOTE, Part 1: Build your own custom test engine for JUnit 5

The standard JUnit tests are fine, but sometimes you want to try something specific. Here’s how.

Repeat after us: JUnit 5 is not a test runner. JUnit 5 is a platform. The JUnit 5 platform was designed from the ground up to solve one problem: to separate the development of test runners from their integration with IDEs and build tools. To this end, JUnit 5 introduces the concept of a test engine. This two-part series will answer the following questions:

◉ What is a JUnit test engine, and why would you want to build one?

◉ How do you build a very simple one?

◉ What do you have to do to integrate your engine with IDEs and build tools? (spoiler: almost nothing)

In part 1 of this “build your own test engine” (BYOTE) series, you will see how a minimal test engine can be implemented, and in part 2, you will see how it can be tested. To learn from the authors of several well-known test engines, part 2 of this series will contain interviews about their experiences in building real-world engines.

Why would anyone build a custom test engine?

Have you ever wanted to build your own test engine? On the JUnit platform, this is easier than you might think. To show off the flexibility of the JUnit platform, you will develop a completely declarative test engine.

Developing functionality is all fun and games, but how do you actually test a test engine? It turns out that the JUnit platform brings tools for exactly that.

But what good is your custom engine if it is hard to execute and get reports for the results? No one will want to use it—probably not even you. Fortunately, the JUnit platform was designed from the ground up to solve this exact problem: Your test engine will be executable in all major IDEs and build tools without almost any effort on your part!

So, apart from curiosity, why would you even want to create a custom engine? Here are three possible reasons.

◉ You want a different testing model than what you can find elsewhere, such as one that focuses on performance, mutation, or property-based testing.

◉ You want improved support for the idioms of a different JVM language such as Groovy, Kotlin, or Clojure.

◉ You want a Java-based tool but with a custom syntax to support the specific requirements of a certain problem domain.

You, of course, might have other reasons, so let’s see how to build a custom engine. Before that, however, a bit of architectural background about JUnit 5 is essential.

JUnit 5 101

Contrary to public opinion, JUnit 5 is a platform rather than a simple test runner. To understand the need for such a platform, it is helpful to take a look at some JUnit history.

Early versions of JUnit were not designed with tool integration in mind. Due to the wild success of those early versions, however, IDEs and build tools began integrating JUnit into their environments quite soon. However, because JUnit was not designed to be executed from third-party processes, integrators sometimes had to rely on dangerous mechanisms, such as reflection, to make things work.

Such integrations were naturally brittle and were very hard to change and maintain because the outside world relied upon, and was coupled to, JUnit’s internals—even private members. An infamous example for this coupling is the breaking of the integration in a widely used IDE when a JUnit 4.x version changed the name of a private field. This situation was only exacerbated by other test libraries and frameworks mimicking JUnit’s structure to leverage JUnit’s IDE integration.

Therefore, while planning and designing the new generation of JUnit, the JUnit team took special care to avoid such coupling. As a matter of fact, the team invited representatives from all major IDEs and build tools to a kick-off meeting in October 2015 to discuss a solid foundation for an integration architecture. The main goal was to provide different APIs for different groups of users, namely

◉ An engine service provider interface (SPI) (junit-platform-engine) for integrators of existing test engines and authors of new test engines

◉ A launcher API (junit-platform-launcher) for IDEs and build tools to provide stable and transparent means of integrating all test engines

◉ An annotation-based API (junit-jupiter-api) for test authors, which would be similar in look and feel to the JUnit 4.x generation but with a more flexible extension model

The first two are the core components of the JUnit 5 platform, and Figure 1 shows the essential parts of the JUnit 5 platform and several engines built upon it.

Oracle Java Certification, Oracle Java Tutorial and Materials, Oracle Java Learning, Oracle Java Preparation, Oracle Java Career, Java Skills, Java Jobs, Java Tutorial and Material
Figure 1. The JUnit 5 platform architecture

This clear separation of concerns is fundamental to the new architecture and has so far served well to avoid the problematic coupling. As a consequence, the JUnit platform has been integrated into all major IDEs and build tools using the launcher API.

Similarly, the platform engine SPI has been used to integrate various test engines with the JUnit 5 platform. This allows test engine authors to concentrate on the test definition and execution concerns and completely disregard the aspect of launching their test cases from IDEs and build tools. A special case is, of course, JUnit’s own Jupiter test engine, which uses the new JUnit 5 test model. However, even this built-in engine uses only the public API and has no secret access to other parts of JUnit 5.

To show how easy it is for engine authors to integrate tools with the JUnit platform, you’ll develop a (very) small test engine from scratch, named WebSmokeTest.

WebSmokeTest: The world’s smallest test engine


For most JVM languages, basing the test model on classes and methods seems a natural fit. However, other test definition models are possible in principle—as long as individual tests can be described unambiguously by an org.junit.platform.engine.TestDescriptor implementation.

Typically, a test descriptor implementation has to be provided by the test engine author and represents a testable element of the given programming model, such as a single test (FieldTestDescriptor) or a container of tests (ClassTestDescriptor).

For the purpose of this article, we want to implement an engine that is both small and lightweight. Hence, we could contemplate alternatives to a method-based test model. One option might be to use lambdas assigned to fields—because lambdas can be considered a form of lightweight methods. This is possible, since we could use java.util.function.Predicate implementations using the aptly named method boolean test(T t) for test execution and the boolean as a success/failure indicator.

While such lambdas might be a bit more lightweight than full-blown methods, maybe we can take this a bit further. We will do so soon, but let’s consider the domain in detail first.

The problem domain: Web smoke testing


As mentioned in the introduction, there can be different reasons for creating a custom engine. Here, you want to support the requirements of a special domain in such a way that creating tests becomes very simple for the test author. As a simple yet still useful example, we pick the domain of HTTP-based smoke tests—in this case, a test that merely tests whether a URL works. Specifically, you need

◉ A succinct way to define the URL against which the smoke test should be executed
◉ A simple means to specify the expected HTTP status code

Consider the test successful if an HTTP GET request against the specified URL results in the specified HTTP status code. As for behavior, the degrees of freedom are extremely limited: WebSmokeTest always does the same thing, namely, execute an HTTP request against a certain server.

Since this test does not need variations in behavior, you can get rid of methods with explicitly programmed statements entirely (or lambdas, for that matter). You can choose a completely declarative approach: The HTTP URLs will be fields of type String. Because you might want to add support for POST and other verbs later, model the HTTP verb as an annotation, and model the expected status code as an argument of the annotation. Hence, a complete smoke test would look like as follows:

@GET(expected = 200)
String shouldReturn200 = "https://blogs.oracle.com/javamagazine/";

The actual implementation described below adds the public and static modifiers—but this is for implementation simplicity only and has no real bearing on the test model.

Agreements must be kept


When you design a custom test engine, it is important to understand the contract between a test engine and the JUnit platform. This contract is defined by the org.junit.platform.engine.TestEngine interface, would looks as follows:

String getId();

TestDescriptor discover(EngineDiscoveryRequest discoveryRequest, UniqueId uniqueId);

void execute(ExecutionRequest request);

Apart from some optional metadata, this interface contains three core responsibilities of a test engine. These core responsibilities are

◉ Identification: The engine must provide a unique string by which it can be referenced and differentiated from other engines on the classpath. For example, Jupiter’s ID is junit-jupiter.

◉ Discovery: The engine must be able to inform the JUnit platform about everything it considers its own test cases. These are arranged in a tree structure, with the returned TestDescriptor being the root node.

◉ Execution: When requested by the platform, the engine must be able to execute a given ExecutionRequest. This request contains a TestDescriptor referencing the tests to be run and provides an EngineExecutionListener to the engine. The former was previously returned by the engine’s own discover method. The latter is then used by the engine’s implementation to fire test lifecycle events, such as executionStarted() or executionFinished().

In many cases, test engines will support a hierarchical test definition model—mirroring Java’s hierarchical structure of packages, classes, and methods. The JUnit platform provides special support for such hierarchical engines in the form of the org.junit.platform.engine.support.hierarchical.HierarchicalTestEngine base class. JUnit’s own Jupiter test engine is itself an extension of this base class. By using this support, advanced features, such as parallel execution, can be readily reused by custom engines. However, for the sake of simplicity and clarity WebSmokeTest will not use this base class; it will implement the required interfaces directly.

Implementing the minimal test engine


A test engine usually consists of the engine class itself and one or more TestDescriptor implementations. In this example, there are also two annotations. This is in no way mandatory—when designing this exercise, we happened to choose an annotation-based testing model. For such implementations, the JUnit platform provides good support with the org.junit.platform.commons.support.AnnotationSupport utility. Listing 1 shows the implementation of the custom test engine.

Listing 1. Implementation of the custom test engine

public class WebSmokeTestEngine implements TestEngine {

    private static final Predicate<Class<?>> IS_WEBSMOKE_TEST_CONTAINER
            = classCandidate -> AnnotationSupport.isAnnotated(classCandidate, WebSmokeTest.class);


    @Override
    public String getId() {
        return "websmoke-test";
    }


    @Override
    public TestDescriptor discover(EngineDiscoveryRequest request, UniqueId uniqueId) {
        TestDescriptor engineDescriptor = new EngineDescriptor(uniqueId, "Web Smoke Test");

        request.getSelectorsByType(ClasspathRootSelector.class).forEach(selector -> {
            appendTestsInClasspathRoot(selector.getClasspathRoot(), engineDescriptor);
        });

        request.getSelectorsByType(PackageSelector.class).forEach(selector -> {
            appendTestsInPackage(selector.getPackageName(), engineDescriptor);
        });

        request.getSelectorsByType(ClassSelector.class).forEach(selector -> {
            appendTestsInClass(selector.getJavaClass(), engineDescriptor);
        });

        return engineDescriptor;
    }

    private void appendTestsInClasspathRoot(URI uri, TestDescriptor engineDescriptor) {
        ReflectionSupport.findAllClassesInClasspathRoot(uri, IS_WEBSMOKE_TEST_CONTAINER, name -> true) //
                .stream() //
                .map(aClass -> new ClassTestDescriptor(aClass, engineDescriptor)) //
                .forEach(engineDescriptor::addChild);
    }

    private void appendTestsInPackage(String packageName, TestDescriptor engineDescriptor) {
        ReflectionSupport.findAllClassesInPackage(packageName, IS_WEBSMOKE_TEST_CONTAINER, name -> true) //
                .stream() //
                .map(aClass -> new ClassTestDescriptor(aClass, engineDescriptor)) //
                .forEach(engineDescriptor::addChild);
    }

    private void appendTestsInClass(Class<?> javaClass, TestDescriptor engineDescriptor) {
        if (AnnotationSupport.isAnnotated(javaClass, WebSmokeTest.class)) {
            engineDescriptor.addChild(new ClassTestDescriptor(javaClass, engineDescriptor));
        }
    }

    @Override
    public void execute(ExecutionRequest request) {
        TestDescriptor root = request.getRootTestDescriptor();

        new SmokeTestExecutor().execute(request, root);
    }

}

In Listing 1, you can see integration, discovery, and execution at work. The discover(EngineDiscoveryRequest, UniqueId) method creates an engine descriptor and adds test descriptors hierarchically, while the EngineDiscoveryRequest gives access to several implementations of org.junit.platform.engine.DiscoverySelector. Such selectors can reference various structural elements of Java (such as methods, classes, packages, and the whole classpath) or the file system (files, directories), as well as JUnit’s own UniqueId instances. The test engine uses these to indicate to the requesting tool (such as an IDE) what it considers test cases associated with every such element according to its specific test model.

The last method in Listing 1 takes care of test execution: execute(ExecutionRequest request) accepts an ExecutionRequest and delegates most of the actual work to a helper class named SmokeTestExecutor. In this class, the various TestDescriptor variants are handled and the individual tests are executed. The most important parts are shown in Listing 2.

Listing 2. The execution of a single test

private void executeTest(ExecutionRequest request, FieldTestDescriptor fieldTestDescriptor) {
    request.getEngineExecutionListener().executionStarted(fieldTestDescriptor);
    TestExecutionResult executionResult = executeTestField(fieldTestDescriptor);
    request.getEngineExecutionListener().executionFinished(fieldTestDescriptor, executionResult);
}

private TestExecutionResult executeTestField(FieldTestDescriptor descriptor) {

    Field testField = descriptor.getTestField();

    try {
        int expected = getExpectedStatusCode(testField);
        String url = getUrl(testField);

        HttpResponse<String> response = this.executeHttpRequest(url);
        int actual = response.statusCode();
        if (expected != actual) {
            var message = String.format("expected HTTP status code %d but received %d from server", expected, actual);
            return TestExecutionResult.failed(new AssertionFailedError(message, expected, actual));
        }

    } catch (Exception e) {
        return TestExecutionResult.failed(new RuntimeException("Failed to execute HTTP request", e));
    }

    return TestExecutionResult.successful();
}

The executeTest method is responsible for sandwiching the actual execution call between lifecycle events. The executeTestField method retrieves the URL and the expected status code, and then it actually executes the HTTP request via a (purely technical) helper method. If a response is received, the method checks the actual status code and creates a TestExecutionResult.failed() with an AssertionFailedError in case the response does not meet the expectation. If sending the request throws an exception, it is wrapped in a more technical RuntimeException and a TestExecutionResult.failed() result. If all goes well, the method returns a TestExecutionResult.successful() result. This basically is the complete custom test engine.

The following example annotates the test class with @WebSmokeTest to identify the test classes. It contains three separate test cases defined by simple fields, and each field is annotated with @GET denoting the need to execute an HTTP GET request. (Supporting POST or other HTTP verbs would be just as simple.)

The target URL of the request is specified in the value of the field. As mentioned above, you have complete freedom in the new test engine regarding how to design a test model. You might have used methods, as most traditional test engines do. Or you might have specified the expected value as a method return type. All are perfectly valid options. Listing 3 shows three test cases.

Listing 3. Three test cases for the new engine

@WebSmokeTest
public class ExampleWebSmokeTests {

    @GET(expected = 200)
    public static String shouldReturn200 = "https://blogs.oracle.com/javamagazine/";

    @GET(expected = 401)
    public static String shouldReturn401 = "https://httpstat.us/401";

    @GET(expected = 201)
    public static String expect201ButGet404 = "https://httpstat.us/404";

}

Now that you have an engine implementation and a number of sample tests in place, you only need to let the platform (and hence, IDEs and build tools) know about the new test engine.

Test engine integration


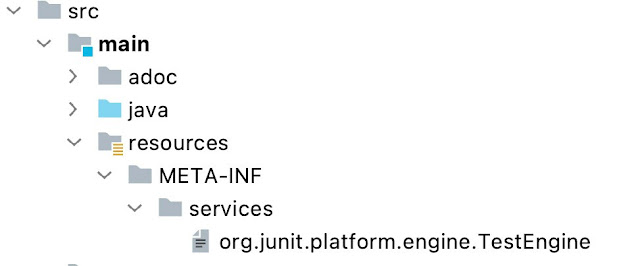
This test engine class can be immediately executed in an IDE such as IntelliJ IDEA if two conditions are fulfilled. First, you need the test engine code on the classpath (typically in a Maven/Gradle dependency). Second, the new engine must be registered with the JUnit platform. This is done via Java’s well-known SPI. To this end, a special file must be present on the classpath, as you can see in Figure 2.

Oracle Java Certification, Oracle Java Tutorial and Materials, Oracle Java Learning, Oracle Java Preparation, Oracle Java Career, Java Skills, Java Jobs, Java Tutorial and Material
Figure 2. The JUnit configuration file using the Java SPI mechanism

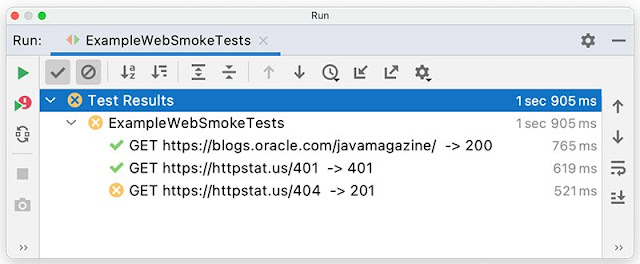
For the SPI mechanism to work, the filename must specify the SPI, here named org.junit.platform.engine.TestEngine. The file contains only one line, the fully qualified name (FQN) of the main engine class, which in this case is org.example.websmoke.engine.WebSmokeTestEngine. This FQN must refer to a class implementing the interface specified by the filename. When the main engine class is executed in the IDE, the test result should look as shown in Figure 3.

Oracle Java Certification, Oracle Java Tutorial and Materials, Oracle Java Learning, Oracle Java Preparation, Oracle Java Career, Java Skills, Java Jobs, Java Tutorial and Material
Figure 3. Execution of the main engine class in the IDE

As can be seen in Figure 3, the project uses domain-specific custom display names to reference the individual test cases in the GUI of the executing IDE. Thus, in this case, you can even display the whole test definition (the URL and the expected status code) right next to the IDE symbol indicating success or failure. Such flexibility is enabled by the TestDescriptor model, freeing the IDE from the need to mechanically display plain method or field names in all cases.

Source: oracle.com

Wednesday, July 20, 2022

Java garbage collection: The 10-release evolution from JDK 8 to JDK 18

Introducing garbage collection, metrics, and trade-offs

The component of the HotSpot JVM that manages the application heap of your application is called the garbage collector (GC). A GC governs the whole lifecycle of application heap objects, beginning when the application allocates memory and continuing through reclaiming that memory for eventual reuse later.

At a very high level, the most basic functionality of garbage collection algorithms in the JVM are the following:

◉ Upon an allocation request for memory from the application, the GC provides memory. Providing that memory should be as quick as possible.

◉ The GC detects memory that the application is never going to use again. Again, this mechanism should be efficient and not take an undue amount of time. This unreachable memory is also commonly called garbage.

◉ The GC then provides that memory again to the application, preferably “in time,” that is, quickly.

There are many more requirements for a good garbage collection algorithm, but these three are the most basic ones and sufficient for this discussion.

There are many ways to satisfy all these requirements, but unfortunately there is no silver bullet and no one-size-fits-all algorithm. For this reason, the JDK provides a few garbage collection algorithms to choose from, and each is optimized for different use cases. Their implementation roughly dictates behavior about one or more of the three main performance metrics of throughput, latency, and memory footprint and how they impact Java applications.

◉ Throughput represents the amount of work that can be done in a given time unit. In terms of this discussion, a garbage collection algorithm that performs more collection work per time unit is preferable, allowing higher throughput of the Java application.

◉ Latency gives an indication of how long a single operation of the application takes. A garbage collection algorithm focused on latency tries to minimize impacting latency. In the context of a GC, the key concerns are whether its operation induces pauses, the extent of any pauses, and how long the pauses may be.

◉ Memory footprint in the context of a GC means how much extra memory beyond the application’s Java heap memory usage the GC needs for proper operation. Data used purely for the management of the Java heap takes away from the application; if the amount of memory the GC (or, more generally, the JVM) uses is less, more memory can be provided to the application’s Java heap.

These three metrics are connected: A high throughput collector may significantly impact latency (but minimizes impact on the application) and the other way around. Lower memory consumption may require the use of algorithms that are less optimal in the other metrics. Lower latency collectors may do more work concurrently or in small steps as part of the execution of the application, taking away more processor resources.

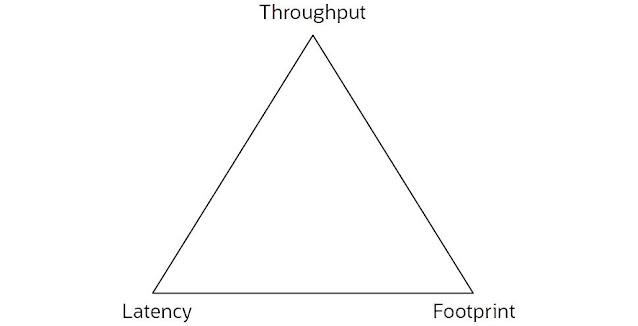
This relationship is often graphed in a triangle with one metric in each corner, as shown in Figure 1. Every garbage collection algorithm occupies a part of that triangle based on where it is targeted and what it is best at.

Java Garbage Collection, Oracle Java Certification, Oracle Java Career, Oracle Java Skills, Oracle Java Jobs, Oracle Java Prep, Oracle Java Learning, Core Java

Figure 1. The GC performance metrics triangle

Trying to improve a GC in one or more of the metrics often penalizes the others.

The OpenJDK GCs in JDK 18


OpenJDK provides a diverse set of five GCs that focus on different performance metrics. Table 1 lists their names, their area of focus, and some of the core concepts used to achieve the desired properties.

Table 1. OpenJDK’s five GCs

Garbage collector Focus area  Concepts
Parallel  Throughput Multithreaded stop-the-world (STW) compaction and generational collection
Garbage First (G1)  Balanced performance  Multithreaded STW compaction, concurrent liveness, and generational collection 
Z Garbage Collector (ZGC) (since JDK 15)  Latency  Everything concurrent to the application 
Shenandoah (since JDK 12)  Latency  Everything concurrent to the application 
Serial  Footprint and startup time  Single-threaded STW compaction and generational collection

The Parallel GC is the default collector for JDK 8 and earlier. It focuses on throughput by trying to get work done as quickly as possible with minimal regard to latency (pauses).

The Parallel GC frees memory by evacuating (that is, copying) the in-use memory to other locations in the heap in more compact form, leaving large areas of then-free memory within STW pauses. STW pauses occur when an allocation request cannot be satisfied; then the JVM stops the application completely, lets the garbage collection algorithm perform its memory compaction work with as many processor threads as available, allocates the memory requested in the allocation, and finally continues execution of the application.

The Parallel GC also is a generational collector that maximizes garbage collection efficiency. More on the idea of generational collection is discussed later.

The G1 GC has been the default collector since JDK 9. G1 tries to balance throughput and latency concerns. On the one hand, memory reclamation work is still performed during STW pauses using generations to maximize efficiency—as is done with the Parallel GC—but at the same time, it tries to avoid lengthy operations in these pauses.

G1 performs lengthy work concurrent to the application, that is, while the application is running using multiple threads. This decreases maximum pause times significantly, at the cost of some overall throughput.

The ZGC and Shenandoah GCs focus on latency at the cost of throughput. They attempt to do all garbage collection work without noticeable pauses. Currently neither is generational. They were first introduced in JDK 15 and JDK 12, respectively, as nonexperimental versions.

The Serial GC focuses on footprint and startup time. This GC is like a simpler and slower version of the Parallel GC, as it uses only a single thread for all work within STW pauses. The heap is also organized in generations. However, the Serial GC excels at footprint and startup time, making it particularly suitable for small, short-running applications due to its reduced complexity.

OpenJDK provides another GC, Epsilon, which I omitted from Table 1. Why? Because Epsilon only allows memory allocation and never performs any reclamation, it does not meet all the requirements for a GC. However, Epsilon can be useful for some very narrow and special-niche applications.

Short introduction to the G1 GC


The G1 GC was introduced in JDK 6 update 14 as an experimental feature, and it was fully supported beginning with JDK 7 update 4. G1 has been the default collector for the HotSpot JVM since JDK 9 due to its versatility: It is stable, mature, very actively maintained, and it’s being improved all the time. I hope the remainder of this article will prove that to you.

How does G1 achieve this balance between throughput and latency?

One key technique is generational garbage collection. It exploits the observation that the most recently allocated objects are the most likely ones that can be reclaimed almost immediately (they “die” quickly). So G1, and any other generational GC, splits the Java heap into two areas: a so-called young generation into which objects are initially allocated and an old generation where objects that live longer than a few garbage collection cycles for the young generation are placed so they can be reclaimed with less effort.

The young generation is typically much smaller than the old generation. Therefore, the effort for collecting it, plus the fact that a tracing GC such as G1 processes only reachable (live) objects during young-generation collections, means the time spent garbage collecting the young generation generally is short, and a lot of memory is reclaimed at the same time.

At some point, longer-living objects are moved into the old generation.

Therefore, from time to time, there is a need to collect garbage and reclaim memory from the old generation as it fills up. Since the old generation is typically large, and it often contains a significant number of live objects, this can take quite some time. (For example, the Parallel GC’s full collections often take many times longer than its young-generation collections.)

For this reason, G1 splits old-generation garbage collection work into two phases.

◉ G1 first traces through the live objects concurrently to the Java application. This moves a large part of the work needed for reclaiming memory from the old generation out of the garbage collection pauses, thus reducing latency. The actual memory reclamation, if done all at once, would still be very time consuming on large application heaps.
◉ Therefore, G1 incrementally reclaims memory from the old generation. After the tracing of live objects, for every one of the next few regular young-generation collections, G1 compacts a small part of the old generation in addition to the whole young generation, reclaiming memory there as well over time.

Reclaiming the old generation incrementally is a bit more inefficient than doing all this work at once (as the Parallel GC does) due to inaccuracies in tracing through the object graph as well as the time and space overhead for managing support data structures for incremental garbage collections, but it significantly decreases the maximum time spent in pauses. As a rough guide, garbage collection times for incremental garbage collection pauses take around the same time as the ones reclaiming only memory from the young generation.

In addition, you can set the pause time goal for both of these types of garbage collection pauses via the MaxGCPauseMillis command-line option; G1 tries to keep the time spent below this value. The default value for this duration is 200 ms. That might or might not be appropriate for your application, but it is only a guide for the maximum. G1 will keep pause times lower than that value if possible. Therefore, a good first attempt to improve pause times is trying to decrease the value of MaxGCPauseMillis.

Progress from JDK 8 to JDK 18


Now that I’ve introduced OpenJDK’s GCs, I’ll detail improvements that have been made to the three metrics—throughput, latency, and memory footprint—for the GCs during the last 10 JDK releases.

Throughput gains for G1. To demonstrate the throughput and latency improvements, this article uses the SPECjbb2015 benchmark. SPECjbb2015 is a common industry benchmark that measures Java server performance by simulating a mix of operations within a supermarket company. The benchmark provides two metrics.

◉ maxjOPS corresponds to the maximum number of transactions the system can provide. This is a throughput metric.
◉ criticaljOPS measures throughput under several service-level agreements (SLAs), such as response times, from 10 ms to 100 ms.

This article uses maxjOPS as a base for comparing the throughput for JDK releases and the actual pause time improvements for latency. While criticaljOPS values are representative of latency induced by pause time, there are other sources that contribute to that score. Directly comparing pause times avoids this problem.

Figure 2 shows maxjOPS results for G1 in composite mode on a 16 GB Java heap, graphed relative to JDK 8 for JDK 11 and JDK 18. As you can see, the throughput scores increase significantly simply by moving to later JDK releases. JDK 11 improves by around 5% and JDK 18 by around 18%, respectively, compared to JDK 8. Simply put, with later JDKs, more resources are available and used for actual work in the application.

Java Garbage Collection, Oracle Java Certification, Oracle Java Career, Oracle Java Skills, Oracle Java Jobs, Oracle Java Prep, Oracle Java Learning, Core Java

Figure 2. G1 throughput gains measured with SPECjbb2015 maxjOPS

The discussion below attempts to attribute these throughput improvements to particular garbage collection changes. However, garbage collection performance, particularly throughput, is also very amenable to other generic improvements such as code compilation, so the garbage collection changes are not responsible for all the uplift.

One significant improvement early in JDK 9 was how G1 starts the old-generation collection lazily, as late as possible.

In JDK 8 the user had to manually set the time when G1 started concurrent tracing of live objects for old-generation collection. If the time was set too early, the JVM did not use all the application heap assigned to the old generation before starting the reclamation work. One drawback was that this did not give the objects in the old generation as much time to become reclaimable. So G1 would not only take more processor resources to analyze liveness because more data was still live, but also G1 would do more work than necessary freeing memory for the old generation.

Another problem was that if the time to start old-generation collection were set to be too late, the JVM might run out of memory, causing a very slow full collection. Beginning with JDK 9, G1 automatically determines an optimal point at which to start old-generation tracing, and it even adapts to the current application’s behavior.

Another idea that was implemented in JDK 9 is related to trying to reclaim large objects in the old generation that G1 automatically places there at a higher frequency than the rest of the old generation. Similar to the use of generations, this is another way the GC focuses on “easy pickings” work that has potentially very high gain—after all, large objects are called large objects because they take lots of space. In some (admittedly rare) applications, this even yields such large reductions in the number of garbage collections and total pause times that G1 beats the Parallel GC on throughput.

In general, every release includes optimizations that make garbage collection pauses shorter while performing the same work. This leads to a natural improvement in throughput. There are many optimizations that could be listed in this article, and the following section about latency improvements points out some of them.

Similar to the Parallel GC, G1 got dedicated nonuniform memory access (NUMA) awareness for allocation to the Java heap in JDK 14. Since then, on computers with multiple sockets where memory access times are nonuniform—that is, where memory is somewhat dedicated to the sockets of the computer, and therefore access to some memory can be slower—G1 tries to exploit locality.

When NUMA awareness applies, the G1 GC assumes that objects allocated on one memory node (by a single thread or thread group) will be mostly referenced from other objects on the same node. Therefore, while an object stays in the young generation, G1 keeps objects on the same node, and it evenly distributes the longer-living objects across nodes in the old generation to minimize access-time variation. This is similar to what the Parallel GC implements.

One more improvement I would like to point out here applies to uncommon situations, the most notable probably being full collections. Normally, G1 tries to prevent full collections by ergonomically adjusting internal parameters. However, in some extreme conditions this is not possible, and G1 needs to perform a full collection during a pause. Until JDK 10, the implemented algorithm was single-threaded, and so it was extremely slow. The current implementation is on par with the Parallel GC’s full garbage collection process. It’s still slow, and something you want to avoid, but it’s much better.

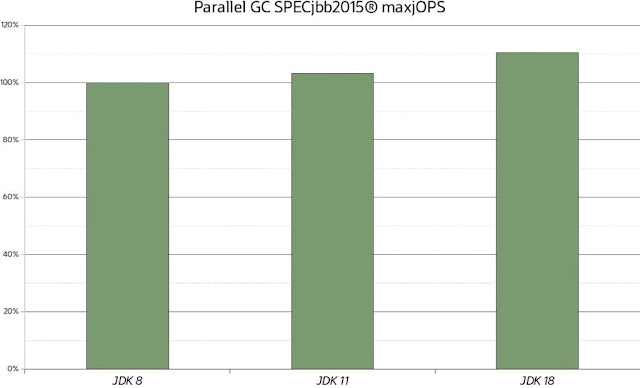
Throughput gains for the Parallel GC. Speaking of the Parallel GC, Figure 3 shows maxjOPS score improvements from JDK 8 to JDK 18 on the same heap configuration used earlier. Again, only by substituting the JVM, even with the Parallel GC, you can get a modest 2% to around a nice 10% improvement in throughput. The improvements are smaller than with G1 because the Parallel GC started off from a higher absolute value, and there has been less to gain.
Java Garbage Collection, Oracle Java Certification, Oracle Java Career, Oracle Java Skills, Oracle Java Jobs, Oracle Java Prep, Oracle Java Learning, Core Java

Figure 3. Throughput gains for the Parallel GC measured with SPECjbb2015 maxjOPS

Latency improvements on G1. To demonstrate latency improvements for HotSpot JVM GCs, this section uses the SPECjbb2015 benchmark with a fixed load and then measures pause times. The Java heap size is set to 16 GB. Table 2 summarizes average and 99th percentile (P99) pause times and relative total pause times within the same interval for different JDK versions at the default pause time goal of 200 ms.

Table 2. Latency improvements with the default pause time of 200 ms

  JDK 8, 200 ms JDK 11, 200 ms JDK 18, 200 ms
Average (ms) 124 111 89
P99 (ms) 176 111 111
Relative collection time (%) n/a -15.8 -34.4

JDK 8 pauses take 124 ms on average, and P99 pauses are 176 ms. JDK 11 improves average pause time to 111 ms and P99 pauses to 134 ms—in total spending 15.8% less time in pauses. JDK 18 significantly improves on that once more, resulting in pauses taking 89 ms on average and P99 pause times taking 104 ms—resulting in 34.4% less time in garbage collection pauses.

I extended the experiment to add a JDK 18 run with a pause time goal set to 50 ms, because I arbitrarily decided that the default for -XX:MaxGCPauseMillis of 200 ms was too long. G1, on average, met the pause time goal, with P99 garbage collection pauses taking 56 ms (see Table 3). Overall, total time spent in pauses did not increase much (0.06%) compared to JDK 8.

In other words, by substituting a JDK 8 JVM with a JDK 18 JVM, you either get significantly decreased average pauses at potentially increased throughput for the same pause time goal, or you can have G1 keep a much smaller pause time goal (50 ms) at the same total time spent in pauses, which roughly corresponds to the same throughput.

Table 3. Latency improvements by setting the pause time goal to 50 ms

  JDK 8, 200 ms JDK 11, 200 ms JDK 18, 200 ms JDK 18, 50 ms
Average (ms) 124 111 89 44
P99 (ms) 176 134 104 56
Relative collection time (%) n/a -15.8 -34.4 +0.06

The results in Table 3 were made possible by many improvements since JDK 8. Here are the most notable ones.

A fairly large contribution to reduced latency was the reduction of the metadata needed to collect parts of the old generation. The so-called remembered sets have been trimmed significantly by both improvements to the data structures themselves as well as to not storing and updating never-needed information. In today’s computer architectures, a reduction in metadata to be managed means much less memory traffic, which improves performance.

Another aspect related to remembered sets is the fact that the algorithm for finding references that point into currently evacuated areas of the heap has been improved to be more amenable to parallelization. Instead of looking through that data structure in parallel and trying to filter out duplicates in the inner loops, G1 now separately filters out remembered-set duplicates in parallel and then parallelizes the processing of the remainder. This makes both steps more efficient and much easier to parallelize.

Further, the processing of these remembered-set entries has been looked at very thoroughly to trim unnecessary code and optimize for the common paths.

Another focus in JDKs later than JDK 8 has been improving the actual parallelization of tasks within a pause: Changes have attempted to improve parallelization either by making phases parallel or by creating larger parallel phases out of smaller serial ones to avoid unnecessary synchronization points. Significant resources have been spent to improve work balancing within parallel phases so that if a thread is out of work, it should be cleverer when looking for work to steal from other threads.

By the way, later JDKs started looking at more uncommon situations, one of them being evacuation failure. Evacuation failure occurs during garbage collection if there is no more space to copy objects into.

Garbage collection pauses on ZGC. In case your application requires even shorter garbage collection pause times, Table 4 shows a comparison with one of the latency-focused collectors, ZGC, on the same workload used earlier. It shows the pause-time durations presented earlier for G1 plus an additional rightmost column showing ZGC.

Table 4. ZGC latency compared to G1 latency

  JDK 8, 200 ms, G1 JDK 18, 200 ms, G1 JDK 18, 50 ms, G1 JDK 18, ZGC
Average (ms) 124 89 44 0.01
P99 (ms) 176 104 56 0.031

ZGC delivers on its promise of submillisecond pause time goals, moving all reclamation work concurrent to the application. Only some minor work to provide closure of garbage collection phases still needs pauses. As expected, these pauses will be very small: in this case, even far below the suggested millisecond range that ZGC aims to provide.

Footprint improvements for G1. The last metric this article will examine is progress in the memory footprint of the G1 garbage collection algorithm. Here, the footprint of the algorithm is defined as the amount of extra memory outside of the Java heap that it needs to provide its functionality.

In G1, in addition to static data dependent on the Java heap size, which takes up approximately 3.2% of the size of the Java heap, often the other main consumer of additional memory is remembered sets that enable generational garbage collection and, in particular, incremental garbage collection of the old generation.

One class of applications that stresses G1’s remembered sets is object caches: They frequently generate references between areas within the old generation of the heap as they add and remove newly cached entries.

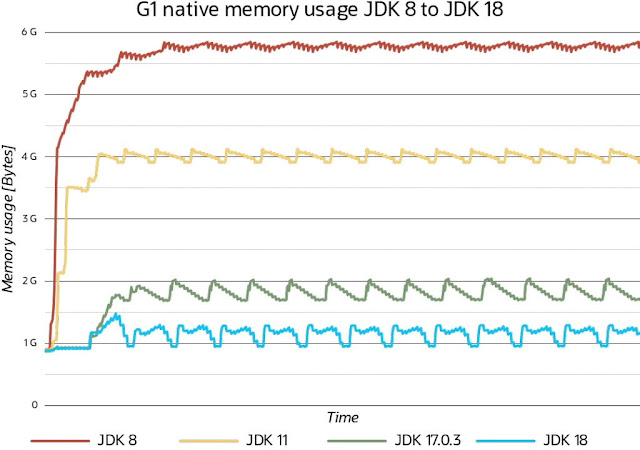
Figure 4 shows G1 native memory usage changes from JDK 8 to JDK 18 on a test application that implements such an object cache: Objects that represent cached information are queried, added, and removed in a least-recently-used fashion from a large heap. This example uses a Java heap of 20 GB, and it uses the JVM’s native memory tracking (NMT) facility to determine memory usage.
Java Garbage Collection, Oracle Java Certification, Oracle Java Career, Oracle Java Skills, Oracle Java Jobs, Oracle Java Prep, Oracle Java Learning, Core Java

Figure 4. The G1 GC’s native memory footprint

With JDK 8, after a short warmup period, G1 native memory usage settles at around 5.8 GB of native memory. JDK 11 improved on that, reducing the native memory footprint to around 4 GB; JDK 17 improved it to around 1.8 GB; and JDK 18 settles at around 1.25 GB of garbage collection native memory usage. This is a reduction of extra memory usage from almost 30% of the Java heap in JDK 8 to around 6% of extra memory usage in JDK 18.

There is no particular cost in throughput or latency associated with these changes, as previous sections showed. Indeed, reducing the metadata the G1 GC maintains generally improved the other metrics so far.

The main principle for these changes from JDK 8 through JDK 18 has been to maintain garbage collection metadata only on a very strict as-needed basis, maintaining only what is expected to be needed when it is needed. For this reason, G1 re-creates and manages this memory concurrently, freeing data as quickly as possible. In JDK 18, enhancements to the representation of this metadata and storing it more densely contributed significantly to the improvement of the memory footprint.

Figure 4 also shows that in later JDK releases G1 increased its aggressiveness, step by step, in giving back memory to the operating system by looking at the difference between peaks and valleys in steady-state operations—in the last release, G1 even does this process concurrently.

The future of garbage collection


Although it is hard to predict what the future holds and what the many projects to improve garbage collection and, in particular, G1, will provide, some of the following developments are more likely to end up in the HotSpot JVM in the future.

One problem that is actively being worked on is removing the need to lock out garbage collection when Java objects are used in native code: Java threads triggering a garbage collection must wait until no other regions are holding references to Java objects in native code. In the worst cases, native code may block garbage collection for minutes. This can lead to software developers choosing to not use native code at all, affecting throughput adversely. With the changes suggested in JEP 423 (Region pinning for G1), this will become a nonissue for the G1 GC.

Another known disadvantage of using G1 compared to the throughput collector, Parallel GC, is its impact on throughput—users report differences in the range of 10% to 20% in extreme cases. The cause of this problem is known, and there have been a few suggestions on how to improve this drawback without compromising other qualities of the G1 GC.

Fairly recently, it’s been determined that pause times and, in particular, work distribution efficiency in the garbage collection pauses are still less than optimal.

One current focus of attention is removing one-half of G1’s largest helper data structure, the mark bitmaps. There are two bitmaps used in the G1 algorithm that help with determining which objects are currently live and can be safely concurrently inspected for references by G1. An open enhancement request indicates that the purpose of one of these bitmaps could be replaced by other means. That would immediately reduce G1 metadata by a fixed 1.5% of the Java heap size.

There is much ongoing activity to change the ZGC and Shenandoah GCs to be generational. In many applications, the current single-generational design of these GCs has too many disadvantages regarding throughput and timeliness of reclamation, often requiring much larger heap sizes to compensate.

Source: oracle.com