Showing posts with label Jakarta EE. Show all posts

Wednesday, February 21, 2024

Unleashing Your Potential: Oracle Java Jakarta EE Career

Unleashing Your Potential: Oracle Java Jakarta EE Career

Introduction


Embarking on a career journey in Oracle Java Jakarta EE is akin to opening a door to a realm of boundless opportunities in the tech industry. As technology continues to evolve at a rapid pace, the demand for skilled professionals proficient in Java Jakarta EE remains consistently high. In this comprehensive guide, we delve into the intricacies of carving out a successful career path in Oracle Java Jakarta EE.

Understanding Oracle Java Jakarta EE


Oracle Java Jakarta EE, formerly known as Java EE (Enterprise Edition), is a powerful platform that enables the development of robust, scalable, and secure enterprise applications. With its extensive set of APIs and frameworks, Jakarta EE empowers developers to build mission-critical applications that meet the diverse needs of modern businesses.

Navigating Career Paths in Oracle Java Jakarta EE


Entry-Level Opportunities

For aspiring developers looking to kickstart their careers in Oracle Java Jakarta EE, entry-level positions offer an ideal starting point. These roles often involve tasks such as coding, debugging, and testing applications under the guidance of experienced mentors. Graduates with a strong foundation in Java programming and a willingness to learn are well-positioned to excel in entry-level roles.

Mid-Level Advancement

As professionals gain experience and expertise in Oracle Java Jakarta EE, they can progress to mid-level positions that offer increased responsibility and autonomy. Mid-level developers are tasked with designing and implementing complex solutions, optimizing application performance, and collaborating with cross-functional teams to deliver high-quality software products.

Leadership and Specialization

At the pinnacle of the career ladder lie leadership roles and specialized positions that require a deep understanding of Oracle Java Jakarta EE principles and best practices. Senior developers, architects, and technical leads play instrumental roles in guiding project teams, driving innovation, and shaping the technological landscape of organizations.

Skills and Competencies


Proficiency in Java Programming

A strong command of Java programming fundamentals forms the cornerstone of a successful career in Oracle Java Jakarta EE. Developers must possess in-depth knowledge of object-oriented programming concepts, data structures, and algorithms to effectively design and implement enterprise-grade solutions.

Familiarity with Jakarta EE APIs and Frameworks

To harness the full potential of Oracle Java Jakarta EE, professionals must familiarize themselves with its extensive set of APIs and frameworks. From servlets and JSPs to EJBs and JPA, proficiency in Jakarta EE technologies empowers developers to build scalable and resilient applications that meet the demands of modern businesses.

Problem-Solving and Analytical Skills

In a dynamic and fast-paced environment, the ability to analyze complex problems and devise innovative solutions is invaluable. Developers skilled in problem-solving techniques and critical thinking excel in navigating challenges and delivering impactful results in Oracle Java Jakarta EE projects.

Continuous Learning and Professional Development


In the ever-evolving landscape of technology, continuous learning is essential for staying abreast of the latest trends and advancements in Oracle Java Jakarta EE. Engaging in online courses, attending workshops, and obtaining industry-recognized certifications are effective ways to expand one's knowledge and enhance career prospects in the field.

Conclusion

Embarking on a career journey in Oracle Java Jakarta EE opens doors to a world of endless possibilities and opportunities for growth. By honing essential skills, embracing lifelong learning, and staying abreast of industry trends, aspiring developers can carve out a rewarding and fulfilling career path in this dynamic field.

Wednesday, December 20, 2023

Autoscale Oracle WebLogic Server for Oracle Container Engine for Kubernetes

Prometheus can do more than monitor Oracle WebLogic Server. It can automatically scale clusters, too.


Elasticity (scaling up or scaling down) of an Oracle WebLogic Server cluster lets you manage resources based on demand and enhances the reliability of your applications while managing resource costs.

This article follows on from Monitoring Oracle WebLogic Server for Oracle Container Engine for Kubernetes, which showed how to use two open source tools— Grafana and Prometheus—to monitor an Oracle WebLogic Server domain deployed in Oracle WebLogic Server for Oracle Cloud Infrastructure (OCI) Container Engine for Kubernetes.

In this article, you’ll learn the steps required to automatically scale an Oracle WebLogic Server cluster provisioned on WebLogic Server for OCI Container Engine for Kubernetes through an Oracle Cloud Marketplace stack when a monitored metric (the total number of open sessions for an application) goes over a threshold. The Oracle WebLogic Monitoring Exporter application scrapes the runtime metrics for specific WebLogic Server instances and feeds them to Prometheus.

Because Prometheus has access to all available WebLogic Server metrics data, you can use any of the metrics data to specify rules for scaling. Based on collected metrics data and configured alert rule conditions, Prometheus’ Alertmanager will send an alert to trigger the desired scaling action and change the number of running managed servers in the WebLogic Server cluster.

You’ll see how to implement a custom notification integration using the webhook receiver, a user-defined REST service that is triggered when a scaling alert event occurs. After the alert rule matches the specified conditions, the Alertmanager sends an HTTP request to the URL specified as a webhook to request the scaling action. (For more information about the webhook used in this sample demo, see this GitHub repository.)

WebLogic Server for OCI Container Engine for Kubernetes is available as a set of applications in Oracle Cloud Marketplace. You use WebLogic Server for OCI Container Engine for Kubernetes to provision a WebLogic Server domain with the WebLogic Server administration server and each managed server running in different pods in the cluster.

WebLogic Server for OCI Container Engine for Kubernetes uses Jenkins to automate the creation of custom images for a WebLogic Server domain and the deployment of these images to the cluster. WebLogic Server for OCI Container Engine for Kubernetes also creates a shared file system and mounts it to WebLogic Server pods, a Jenkins controller pod, and an admin host instance.

The application provisions a public load balancer to distribute traffic across the managed servers in your domain and a private load balancer to provide access to the WebLogic Server administration console and the Jenkins console.

WebLogic Server for OCI Container Engine for Kubernetes also creates an NGINX ingress controller in the cluster. NGINX is an open-source reverse proxy that controls the flow of traffic to pods within the cluster. The ingress controller is used to expose services of type Load Balancer using the load balancing capabilities of Oracle Cloud Infrastructure Load Balancing and Oracle Container Engine for Kubernetes.

Overview: How it all works


Figure 1 shows the WebLogic Server for OCI Container Engine for Kubernetes cluster components. The WebLogic Server domain consists of one administration server (AS) pod, one or more managed server (MS) pods, and the Oracle WebLogic Monitoring Exporter application deployed on the WebLogic Server cluster.

Autoscale Oracle WebLogic Server for Oracle Container Engine for Kubernetes
Figure 1. The cluster components

Additional components are the Prometheus pods, the Alertmanager pods, the webhook server pod, and the Oracle WebLogic Server Kubernetes Operator.

The six steps shown in Figure 1 are as follows:

  1. Scrape metrics from managed servers: The Prometheus server scrapes the metrics from the WebLogic Server pods. The pods are annotated to let the Prometheus server know the metrics endpoint available for scraping the WebLogic Server metrics.
  2. Create alert: Alertmanager evaluates the alert rules and creates an alert when an alert condition is met.
  3. Send alert: The alert is sent to the webhook application hook endpoint defined in the Alertmanager configuration.
  4. Invoke scaling action: When the webhook application’s hook is triggered, it initiates the scaling action, which is to scale up or down the WebLogic Server cluster.
  5. Request scale up/down: The Oracle WebLogic Server Kubernetes Operator invokes Kubernetes APIs to perform the scaling.
  6. Scale up/down the cluster: The cluster is scaled up or down by setting the value for the domain custom resource’s spec.clusters[].replicas parameter.

Figure 2 is a network diagram showing all the components of the WebLogic Server for OCI Container Engine for Kubernetes stack, including the admin host and bastion host provisioned with the stack. The figure also depicts the placement of different pods in the following two node pools:

◉ The WebLogic Server pods go on the WebLogic Server node pool.
◉ The Prometheus, Alertmanager, and other non-WebLogic Server pods are placed on the non-WebLogic Server node pool of the WebLogic Server for OCI Container Engine for Kubernetes stack.

Autoscale Oracle WebLogic Server for Oracle Container Engine for Kubernetes

Figure 2. Network diagram for the stack

There are three things you should be aware of.

  • The setup for the Prometheus deployment and autoscaling will be carried out from the admin host.
  • The WebLogic Server for OCI Container Engine for Kubernetes stack comes with Jenkins-based continuous integration and continuous deployment (CI/CD) to automate the creation of updated domain Docker images. The testwebapp application deployment, described below, uses Jenkins to update the domain Docker image with the testwebapp application.
  • All images referenced by pods in the cluster are stored in Oracle Cloud Infrastructure Registry. The webhook application’s Docker image will be pushed to Oracle Cloud Infrastructure Registry, and the deployment of the webhook will use the image tagged as Webhook:latest from Oracle Cloud Infrastructure Registry.

Prerequisites for this project


The article Monitoring Oracle WebLogic Server for Oracle Container Engine for Kubernetes describes how to install Prometheus community Helm charts on WebLogic Server for OCI Container Engine for Kubernetes. The Prometheus Helm charts will also deploy Alertmanager. The article also describes deploying the Oracle WebLogic Monitoring Exporter application using a WebLogic Server for OCI Container Engine for Kubernetes CI/CD pipeline.

This article builds on what was covered earlier and assumes you have already provisioned a WebLogic Server for OCI Container Engine for Kubernetes cluster through an Oracle Cloud Marketplace stack and set up Prometheus and Alertmanager. You should verify the following prerequisites are met:

  • The Prometheus and Alertmanager pods are up and running in the monitoring namespace.
  • The Prometheus and Alertmanager consoles are accessible via the internal load balancer’s IP address.
  • The WebLogic Server metrics exposed by the Oracle WebLogic Monitoring Exporter application are available and seen from the Prometheus console.

You should also access the testwebapp that will be used for this project.

Demonstrating WebLogic Server cluster scaling in five steps


The goal here is to demonstrate the scaling action on the WebLogic Server cluster based on one of several metrics exposed by the Oracle WebLogic Monitoring Exporter application. This is done by scaling up the WebLogic Server cluster when the total open-sessions count for an application exceeds a threshold. There are several other metrics that the Oracle WebLogic Monitoring Exporter application exposes, which can be used for defining the alert rule for scaling up or scaling down the WebLogic Server cluster.

For the sake of brevity, the webhook pod is deployed on any of the node pools but, ideally, it should be deployed to the non-WebLogic Server node pool (identified by the label Jenkins) using the nodeSelector in the pod deployment.

There are five steps required to automatically scale a WebLogic Server cluster provisioned on WebLogic Server for OCI Container Engine for Kubernetes through Oracle Cloud Marketplace when a monitored metric goes over a configured threshold. For this article, the triggering metric will be the number of open sessions for an application.

The steps are as follows:

  1. Deploy a testwebapp application to the WebLogic Server cluster.
  2. Create the Docker image for a webhook application.
  3. Deploy the webhook application in the cluster.
  4. Set up Alertmanager to send out alerts to the webhook application endpoint.
  5. Configure an Alertmanager rule to send out the alert when the total number of open sessions for the testwebapp across all servers in the WebLogic Server cluster exceeds a configured threshold value.

Once this work is complete, you can trigger the alert condition and then observe that the WebLogic Server cluster is properly scaled as a result.

Step 1: Deploy the testwebapp


You will start by deploying the testwebapp application to the WebLogic Server cluster.

First, create the testwebapp archive zip file that bundles the testwebapp.war file with the Oracle WebLogic Server Deploy Toolkit deployment model YAML file. Execute the following steps from the WebLogic Server for OCI Container Engine for Kubernetes admin host instance.

cd /u01/shared
mkdir -p wlsdeploy/applications
rm -f wlsdeploy/applications/wls-exporter.war
mkdir -p model
wget https://github.com/bhabermaas/kubernetes-projects/raw/master/apps/testwebapp.war -P wlsdeploy/applications

DOMAIN_CLUSTER_NAME=$(curl -s -H "Authorization: Bearer Oracle" http://169.254.169.254/opc/v2/instance/ | jq -r '.metadata.wls_cluster_name')
cat > model/deploy-testwebapp.yaml << EOF
appDeployments:
  Application:
    'testwebapp' :
      SourcePath: 'wlsdeploy/applications/testwebapp.war'
      Target: '$DOMAIN_CLUSTER_NAME'
      ModuleType: war
      StagingMode: nostage
EOF

zip -r testwebapp_archive.zip wlsdeploy model

The contents of the testwebapp_archive.zip file are shown below.

[opc@wrtest12-admin shared]$ unzip -l testwebapp_archive.zip
Archive:  testwebapp_archive.zip
  Length      Date    Time    Name
---------  ---------- -----   ----
        0  07-27-2021 04:47   wlsdeploy/
        0  08-20-2021 23:21   wlsdeploy/applications/
     3550  08-20-2021 23:22   wlsdeploy/applications/testwebapp.war
        0  08-20-2021 23:20   model/
      190  08-20-2021 23:22   model/deploy-testwebapp.yaml
---------                     -------
     3740                     5 files

The script above creates a testwebapp_archive.zip file that can be used with WebLogic Server for OCI Container Engine for Kubernetes in an update-domain CI/CD pipeline job. Open the Jenkins console and browse to the update-domain job. Click Build with Parameters. For Archive Source, select Shared File System, and set Archive File Location to /u01/shared/testwebapp_archive.zip, as shown in Figure 3.

Autoscale Oracle WebLogic Server for Oracle Container Engine for Kubernetes
Figure 3. The parameters for the Jenkins pipeline update-domain build

Once the job is complete, the testwebapp application should be deployed. You can verify that it’s accessible by executing the following script on the admin host. The return code should be 200, indicating that the testwebapp is accessible via the external load balancer IP address.

INGRESS_NS=$(curl -s -H "Authorization: Bearer Oracle" http://169.254.169.254/opc/v2/instance/ | jq -r '.metadata.ingress_namespace')
SERVICE_NAME=$(curl -s -H "Authorization: Bearer Oracle" http://169.254.169.254/opc/v2/instance/ | jq -r '.metadata.service_name')
EXTERNAL_LB_IP=$(kubectl get svc "$SERVICE_NAME-external" -n $INGRESS_NS -ojsonpath="{.status.loadBalancer.ingress[0].ip}")
curl -kLs -o /dev/null -I -w "%{http_code}" https://$EXTERNAL_LB_IP/testwebapp

Step 2: Create the webhook application Docker image


The example in this article uses the webhook application, which is third-party open source code available on GitHub. I am using webhook version 2.6.4. Here is how to create the Docker image.

Create the apps, scripts, and webhook directories, as follows:

cd /u01/shared
mkdir -p Webhook/apps
mkdir -p Webhook/scripts
mkdir -p Webhook/Webhooks

Copy the webhook executable to the apps directory.

wget -O Webhook/apps/Webhook https://github.com/bhabermaas/kubernetes-projects/raw/master/apps/Webhook
chmod +x Webhook/apps/Webhook

Download the scalingAction.sh script file into the scripts directory, as follows:

wget https://raw.githubusercontent.com/oracle/Oracle WebLogic-kubernetes-operator/main/operator/scripts/scaling/scalingAction.sh -P Webhook/scripts

Create scaleUpAction.sh in the scripts directory.

DOMAIN_NS=$(curl -s -H "Authorization: Bearer Oracle" http://169.254.169.254/opc/v2/instance/ | jq -r '.metadata.wls_domain_namespace')
DOMAIN_UID=$(curl -s -H "Authorization: Bearer Oracle" http://169.254.169.254/opc/v2/instance/ | jq -r '.metadata.wls_domain_uid')
OPERATOR_NS=$(curl -s -H "Authorization: Bearer Oracle" http://169.254.169.254/opc/v2/instance/ | jq -r '.metadata.wls_operator_namespace')
SERVICE_NAME=$(curl -s -H "Authorization: Bearer Oracle" http://169.254.169.254/opc/v2/instance/ | jq -r '.metadata.service_name')
CLUSTER_NAME=$(curl -s -H "Authorization: Bearer Oracle" http://169.254.169.254/opc/v2/instance/ | jq -r '.metadata.wls_cluster_name')

cat > Webhook/scripts/scaleUpAction.sh << EOF
#!/bin/bash

echo scale up action >> scaleup.log

MASTER=https://\$KUBERNETES_SERVICE_HOST:\$KUBERNETES_PORT_443_TCP_PORT

echo Kubernetes master is \$MASTER

source /var/scripts/scalingAction.sh --action=scaleUp --domain_uid=$DOMAIN_UID --cluster_name=$CLUSTER_NAME --kubernetes_master=\$MASTER --wls_domain_namespace=$DOMAIN_NS --operator_namespace=$OPERATOR_NS --operator_service_name=internal-Oracle WebLogic-operator-svc --operator_service_account=$SERVICE_NAME-operator-sa 

EOF
chmod +x Webhook/scripts/*

Similar to the script listed above, you can create a scaleDownAction.sh script by passing the --action=scaleDown parameter to the scalingAction.sh script.

Create Dockerfile.Webhook for the webhook application, as follows. Note that the code below uses an http endpoint for the webhook application. To have the application serve hooks over HTTPS (which would obviously be more secure in a real deployment, but more complex for this example), see the webhook app documentation.

cat > Webhook/Dockerfile.Webhook << EOF
FROM store/oracle/serverjre:8

COPY apps/Webhook /bin/Webhook

COPY Webhooks/hooks.json /etc/Webhook/

COPY scripts/scaleUpAction.sh /var/scripts/

COPY scripts/scalingAction.sh /var/scripts/

RUN chmod +x /var/scripts/*.sh

CMD ["-verbose", "-hooks=/etc/Webhook/hooks.json", "-hotreload"]

ENTRYPOINT ["/bin/Webhook"]
EOF

Create the hooks.json file in the Webhooks directory. Similar to scaleup, you can define a hook for scaledown that invokes the scaleDownAction.sh script.

cat > Webhook/Webhooks/hooks.json << EOF
[
  {
    "id": "scaleup",
     "execute-command": "/var/scripts/scaleUpAction.sh",
     "command-working-directory": "/var/scripts",
     "response-message": "scale-up call ok\n"
  }
]
EOF

Build the webhook Docker image tagged as Webhook:latest and push it to the Oracle Cloud Infrastructure Registry repository. Use Docker hub credentials to log in to the Docker hub before doing a Docker build.

cd Webhook
OCIR_URL=$(curl -s -H "Authorization: Bearer Oracle" http://169.254.169.254/opc/v2/instance/ | jq -r '.metadata.ocir_url')
OCIR_USER=$(curl -s -H "Authorization: Bearer Oracle" http://169.254.169.254/opc/v2/instance/ | jq -r '.metadata.ocir_user')
OCIR_PASSWORD_OCID=$(curl -s -H "Authorization: Bearer Oracle" http://169.254.169.254/opc/v2/instance/ | jq -r '.metadata.ocir_password')
OCIR_PASSWORD=$(python /u01/scripts/utils/oci_api_utils.py get_secret $OCIR_PASSWORD_OCID)
OCIR_NS=$(curl -s -H "Authorization: Bearer Oracle" http://169.254.169.254/opc/v2/instance/ | jq -r '.metadata.ocir_namespace')

docker image rm Webhook:latest
docker login -u <docker hub="" user=""> -p <docker hub="" password="">
docker build -t Webhook:latest -f Dockerfile.Webhook .
docker image tag Webhook:latest $OCIR_URL/$OCIR_NS/Webhook
docker login $OCIR_URL -u $OCIR_USER  -p "$OCIR_PASSWORD"
docker image push $OCIR_URL/$OCIR_NS/Webhook
</docker></docker>

Step 3: Deploy the webhook application into the WebLogic Server OCI Container Engine for Kubernetes cluster


Now that the webhook application Docker image has been pushed out to Oracle Cloud Infrastructure Registry, you can update the Webhook-deployment.yaml file to use that image.

Start by creating the ocirsecrets secret file in the monitoring namespace for the webhook deployment. It will be able to pull the Webhook:latest image from Oracle Cloud Infrastructure Registry

OCIR_URL=$(curl -s -H "Authorization: Bearer Oracle" http://169.254.169.254/opc/v2/instance/ | jq -r '.metadata.ocir_url')
OCIR_USER=$(curl -s -H "Authorization: Bearer Oracle" http://169.254.169.254/opc/v2/instance/ | jq -r '.metadata.ocir_user')
OCIR_PASSWORD_OCID=$(curl -s -H "Authorization: Bearer Oracle" http://169.254.169.254/opc/v2/instance/ | jq -r '.metadata.ocir_password')
OCIR_PASSWORD=$(python /u01/scripts/utils/oci_api_utils.py get_secret $OCIR_PASSWORD_OCID)
kubectl create secret docker-registry ocirsecrets  --docker-server="$OCIR_URL" --docker-username="$OCIR_USER" --docker-password="$OCIR_PASSWORD" -n monitoring

Run the following script, which downloads the Webhook-deployment.yaml file and updates it with imagePullSecrets.

cd /u01/shared
wget https://raw.githubusercontent.com/bhabermaas/kubernetes-projects/master/kubernetes/Webhook-deployment.yaml -P prometheus

OCIR_URL=$(curl -s -H "Authorization: Bearer Oracle" http://169.254.169.254/opc/v2/instance/ | jq -r '.metadata.ocir_url')
OCIR_NS=$(curl -s -H "Authorization: Bearer Oracle" http://169.254.169.254/opc/v2/instance/ | jq -r '.metadata.ocir_namespace')
OPERATOR_NS=$(curl -s -H "Authorization: Bearer Oracle" http://169.254.169.254/opc/v2/instance/ | jq -r '.metadata.wls_operator_namespace')
INTERNAL_OPERATOR_CERT_VAL=$(kubectl get configmap Oracle WebLogic-operator-cm -n $OPERATOR_NS -o jsonpath='{.data.internalOperatorCert}')
sed -i "s/extensions\/v1beta1/apps\/v1/g" prometheus/Webhook-deployment.yaml
sed -i "s/verbs: \[\"get\", \"list\", \"watch\", \"update\"\]/verbs: \[\"get\", \"list\", \"watch\", \"update\", \"patch\"\]/g" prometheus/Webhook-deployment.yaml
sed -i "s/image: Webhook:latest/image: $OCIR_URL\/$OCIR_NS\/Webhook:latest/g" prometheus/Webhook-deployment.yaml
sed -i "s/imagePullPolicy: .*$/imagePullPolicy: Always/g" prometheus/Webhook-deployment.yaml
sed -i "s/value: LS0t.*$/value: $INTERNAL_OPERATOR_CERT_VAL/g" prometheus/Webhook-deployment.yaml
sed -i "85 i \ \ \ \ \ \ imagePullSecrets:" prometheus/Webhook-deployment.yaml
sed -i "86 i  \ \ \ \ \ \ \ \ - name: ocirsecrets" prometheus/Webhook-deployment.yaml

To help you see what the script above did, here’s a sample updated Webhook-deployment.yaml file.

apiVersion: rbac.authorization.k8s.io/v1beta1
kind: ClusterRole
metadata:
  name: Webhook
rules:
- apiGroups: [""]
  resources:
  - nodes
  - namespaces
  - nodes/proxy
  - services
  - endpoints
  - pods
  - services/status
  verbs: ["get", "list", "watch"]
- apiGroups:
  - extensions
  resources:
  - ingresses
  verbs: ["get", "list", "watch"]
- apiGroups: ["Oracle WebLogic.oracle"]
  resources: ["domains"]
  verbs: ["get", "list", "watch", "update", "patch"]
---

apiVersion: v1
kind: ServiceAccount
metadata:
  name: default
  namespace: monitoring
---

apiVersion: rbac.authorization.k8s.io/v1beta1
kind: ClusterRoleBinding
metadata:
  name: Webhook
roleRef:
  apiGroup: rbac.authorization.k8s.io
  kind: ClusterRole
  name: Webhook
subjects:
- kind: ServiceAccount
  name: default
  name: default
  namespace: monitoring
---

apiVersion: apps/v1
kind: Deployment
metadata:
  labels:
    name: Webhook
  name: Webhook
  namespace: monitoring
spec:
  replicas: 1
  selector:
    matchLabels:
      name: Webhook
  template:
    metadata:
      creationTimestamp: null
      labels:
         name: Webhook
    spec:
      containers:
      - image: iad.ocir.io/idiaaaawa6h/Webhook:latest
        imagePullPolicy: Always
        name: Webhook
        env:
        - name: INTERNAL_OPERATOR_CERT
          value: LS0tLS1CRUdJTiBDRVJUSUZJQ0FUR...NBVEUtLS0tLQo=
        ports:
        - containerPort: 9000
          protocol: TCP
        resources:
          limits:
            cpu: 500m
            memory: 2500Mi
          requests:
            cpu: 100m
            memory: 100Mi
      restartPolicy: Always
      securityContext: {}
      terminationGracePeriodSeconds: 30
      imagePullSecrets:
        - name: ocirsecrets
---

apiVersion: v1
kind: Service
metadata:
  name: Webhook
  namespace: monitoring
spec:
  selector:
    name: Webhook
  type: ClusterIP
  ports:
  - port: 9000

Now you can deploy the webhook.

kubectl apply -f prometheus/Webhook-deployment.yaml
while [[ $(kubectl get pods -n monitoring -l name=Webhook -o 'jsonpath={..status.conditions[?(@.type=="Ready")].status}') != "True" ]]; do echo "waiting for pod" && sleep 1; done

Verify that all resources are running in the monitoring namespace.

[opc@wrtest12-admin shared]$ kubectl get all -n monitoring
NAME                                                 READY   STATUS    RESTARTS   AGE
pod/grafana-5b475466f7-hfr4v                         1/1     Running   0          17d
pod/prometheus-alertmanager-5c8db4466d-trpnt         2/2     Running   0          46h
pod/prometheus-kube-state-metrics-86dc6bb59f-6cfnd   1/1     Running   0          46h
pod/prometheus-node-exporter-cgtnd                   1/1     Running   0          46h
pod/prometheus-node-exporter-fg9m8                   1/1     Running   0          46h
pod/prometheus-server-649d869bd4-swxmk               2/2     Running   0          46h
pod/Webhook-858cb4b794-mwfqp                         1/1     Running   0          8h

NAME                                    TYPE        CLUSTER-IP      EXTERNAL-IP   PORT(S)        AGE
service/grafana                         ClusterIP   10.96.106.93    <none>        80/TCP         17d
service/prometheus-alertmanager         NodePort    10.96.172.217   <none>        80:32000/TCP   46h
service/prometheus-kube-state-metrics   ClusterIP   10.96.193.169   <none>        8080/TCP       46h
service/prometheus-node-exporter        ClusterIP   None            <none>        9100/TCP       46h
service/prometheus-server               NodePort    10.96.214.99    <none>        80:30000/TCP   46h
service/Webhook                         ClusterIP   10.96.238.121   <none>        9000/TCP       8h

NAME                                      DESIRED   CURRENT   READY   UP-TO-DATE   AVAILABLE   NODE SELECTOR   AGE
daemonset.apps/prometheus-node-exporter   2         2         2       2            2           <none>          46h

NAME                                            READY   UP-TO-DATE   AVAILABLE   AGE
deployment.apps/grafana                         1/1     1            1           17d
deployment.apps/prometheus-alertmanager         1/1     1            1           46h
deployment.apps/prometheus-kube-state-metrics   1/1     1            1           46h
deployment.apps/prometheus-server               1/1     1            1           46h
deployment.apps/Webhook                         1/1     1            1           8h

NAME                                                       DESIRED   CURRENT   READY   AGE
replicaset.apps/grafana-5b475466f7                         1         1         1       17d
replicaset.apps/prometheus-alertmanager-5c8db4466d         1         1         1       46h
replicaset.apps/prometheus-kube-state-metrics-86dc6bb59f   1         1         1       46h
replicaset.apps/prometheus-server-649d869bd4               1         1         1       46h
replicaset.apps/Webhook-858cb4b794                         1         1         1       8h
</none></none></none></none></none></none></none>

Step 4: Configuring Alertmanager


It’s time to set up Alertmanager to send out alerts to the webhook application endpoint. The trigger rules for those alerts will be configured in Step 5.

You should verify that the metric wls_webapp_config_open_sessions_current_count is listed in the drop-down list that shows all the metrics in the Prometheus console. This is the metric that will be used in the alert rule. Browse to the Prometheus console and click Open Metrics Explorer to verify the metric wls_webapp_config_open_sessions_current_count is available, as shown in Figure 4.

Autoscale Oracle WebLogic Server for Oracle Container Engine for Kubernetes
Figure 4. Verifying the metric is listed in the Prometheus console

The expression sum(wls_webapp_config_open_sessions_current_count{app="testwebapp"}) > 15 checks for open sessions for the testwebapp across all managed servers. For example, if the value of the open-sessions count on managed server 1 for testwebapp is 10 and on managed server 2 it is 8, the total open-sessions count will be 18. In that case, the alert will be fired.

Verify the expression and the current value of the metric from the Prometheus console, as shown in Figure 5.

Autoscale Oracle WebLogic Server for Oracle Container Engine for Kubernetes
Figure 5. Verifying the expression and current value of the trigger metric

Configure Alertmanager to invoke the webhook when an alert is received. To do this, edit the prometheus-alertmanager configmap file, as shown below. The script also changes the URL from http://Webhook.Webhook.svc.cluster.local:8080/log to http://Webhook:9000/hooks/scaleup, and it changes the receiver name from logging-Webhook to web.hook.

kubectl get configmap prometheus-alertmanager -n monitoring -o yaml > prometheus/prometheus-alertmanager-cm.yaml
sed -i "s/name: logging-Webhook/name: web.hook/g" prometheus/prometheus-alertmanager-cm.yaml
sed -i "s/receiver: logging-Webhook/receiver: web.hook/g" prometheus/prometheus-alertmanager-cm.yaml
sed -i "s/url: .*$/url: http:\/\/Webhook:9000\/hooks\/scaleup/g" prometheus/prometheus-alertmanager-cm.yaml
kubectl apply -f prometheus/prometheus-alertmanager-cm.yaml

Step 5: Update the Alertmanager rule


Here is how to update the Prometheus Alertmanager rule to send the alert when the total number of open sessions for the testwebapp across all servers in the WebLogic Server cluster exceeds the configured threshold value of 15.

kubectl get configmap prometheus-server -n monitoring -o yaml > prometheus/prometheus-server-cm.yaml
sed -i "18 i \ \ \ \ \ \ - alert: ScaleUp" prometheus/prometheus-server-cm.yaml
sed -i "19 i \ \ \ \ \ \ \ \ annotations:" prometheus/prometheus-server-cm.yaml
sed -i "20 i \ \ \ \ \ \ \ \ \ \ description: Firing when total sessions active greater than 15" prometheus/prometheus-server-cm.yaml
sed -i "21 i \ \ \ \ \ \ \ \ \ \ summary: Scale up when current sessions is greater than 15" prometheus/prometheus-server-cm.yaml
sed -i "22 i \ \ \ \ \ \ \ \ expr: sum(wls_webapp_config_open_sessions_current_count{app=\"testwebapp\"}) > 15" prometheus/prometheus-server-cm.yaml
sed -i "23 i \ \ \ \ \ \ \ \ for: 1m" prometheus/prometheus-server-cm.yaml
kubectl apply -f prometheus/prometheus-server-cm.yaml

Verify the alert rule shows up in the Prometheus alerts screen, as shown in Figure 6. Be patient: It may take a couple of minutes for the rule to show up.

Autoscale Oracle WebLogic Server for Oracle Container Engine for Kubernetes
Figure 6. Verifying that the alert rule appears in Prometheus

See if everything works


All the pieces are in place to autoscale the WebLogic Server cluster. To see if autoscaling works, create an alert by opening more than the configured 15 sessions of the testwebapp application. You can do that by using the following script to create 17 sessions using curl from the WebLogic Server for OCI Container Engine for Kubernetes admin host.

cat > max_sessions.sh << EOF
#!/bin/bash
COUNTER=0

MAXCURL=17

while [ \$COUNTER -lt \$MAXCURL ]; do
   curl -kLs -o /dev/null -I -w "%{http_code}" https://\$1/testwebapp
   let COUNTER=COUNTER+1
   sleep 1
done
EOF

chmod +x max_sessions.sh

Next, run this script from the admin host.

INGRESS_NS=$(curl -s -H "Authorization: Bearer Oracle" http://169.254.169.254/opc/v2/instance/ | jq -r '.metadata.ingress_namespace')
SERVICE_NAME=$(curl -s -H "Authorization: Bearer Oracle" http://169.254.169.254/opc/v2/instance/ | jq -r '.metadata.service_name')
EXTERNAL_LB_IP=$(kubectl get svc "$SERVICE_NAME-external" -n $INGRESS_NS -ojsonpath="{.status.loadBalancer.ingress[0].ip}")
echo $EXTERNAL_LB_IP
./max_sessions.sh $EXTERNAL_LB_IP

You can verify the current value for the open-sessions metric again in the Prometheus console. The sum of the values across all managed servers should show at least 17, as shown in Figure 7.

Autoscale Oracle WebLogic Server for Oracle Container Engine for Kubernetes
Figure 7. Verifying the number of open testwebapp sessions

After that, verify the ScaleUp alert is in the firing state (the state will change from inactive to pending to firing), as shown in Figure 8. It may take couple moments to change states.

Autoscale Oracle WebLogic Server for Oracle Container Engine for Kubernetes
Figure 8. Confirming the ScaleUp alert is firing

Once the alert has fired, the automatic scaling of the WebLogic Server cluster should be triggered via the webhook. You can verify that scaling has been triggered by looking into the webhook pod’s logs and by looking at the number of managed server pods in the domain namespace.

First, verify the webhook pod’s log, as shown below, to see if the scaling was triggered and handled without issue.

[opc@wrtest12-admin shared]$ kubectl logs Webhook-858cb4b794-mwfqp -n monitoring
[Webhook] 2021/08/23 18:41:46 version 2.6.4 starting
[Webhook] 2021/08/23 18:41:46 setting up os signal watcher
[Webhook] 2021/08/23 18:41:46 attempting to load hooks from /etc/Webhook/hooks.json
[Webhook] 2021/08/23 18:41:46 os signal watcher ready
[Webhook] 2021/08/23 18:41:46 found 1 hook(s) in file
[Webhook] 2021/08/23 18:41:46   loaded: scaleup
[Webhook] 2021/08/23 18:41:46 setting up file watcher for /etc/Webhook/hooks.json
[Webhook] 2021/08/23 18:41:46 serving hooks on http://0.0.0.0:9000/hooks/{id}
[Webhook] 2021/08/23 18:53:29 incoming HTTP request from 10.244.0.68:49284
[Webhook] 2021/08/23 18:53:29 scaleup got matched
[Webhook] 2021/08/23 18:53:29 scaleup hook triggered successfully
[Webhook] 2021/08/23 18:53:29 2021-08-23T18:53:29Z | 200 |    725.833µs | Webhook:9000 | POST /hooks/scaleup
[Webhook] 2021/08/23 18:53:29 executing /var/scripts/scaleUpAction.sh (/var/scripts/scaleUpAction.sh) with arguments ["/var/scripts/scaleUpAction.sh"] and environment [] using /var/scripts as cwd
[Webhook] 2021/08/23 18:53:30 command output: Kubernetes master is https://10.96.0.1:443

[Webhook] 2021/08/23 18:53:30 finished handling scaleup
[Webhook] 2021/08/23 19:49:19 incoming HTTP request from 10.244.0.68:60516
[Webhook] 2021/08/23 19:49:19 scaleup got matched
[Webhook] 2021/08/23 19:49:19 scaleup hook triggered successfully
[Webhook] 2021/08/23 19:49:19 2021-08-23T19:49:19Z | 200 |    607.125µs | Webhook:9000 | POST /hooks/scaleup
[Webhook] 2021/08/23 19:49:19 executing /var/scripts/scaleUpAction.sh (/var/scripts/scaleUpAction.sh) with arguments ["/var/scripts/scaleUpAction.sh"] and environment [] using /var/scripts as cwd
[Webhook] 2021/08/23 19:49:21 command output: Kubernetes master is https://10.96.0.1:443

[Webhook] 2021/08/23 19:49:21 finished handling scaleup

And verify that the managed server count has changed from 2 to 3.

[opc@wrtest12-admin shared]$ kubectl get po -n wrtest12-domain-ns
NAME                                      READY   STATUS    RESTARTS   AGE
wrtest12domain-wrtest12-adminserver       1/1     Running   0          29h
wrtest12domain-wrtest12-managed-server1   1/1     Running   0          29h
wrtest12domain-wrtest12-managed-server2   1/1     Running   0          5m22s
wrtest12domain-wrtest12-managed-server3   1/1     Running   0          92s

Source: oracle.com

Wednesday, November 22, 2023

Transition from Java EE to Jakarta EE

What happened and what you need to know


Java EE is undoubtedly one of the most recognizable frameworks for server-side Java. It essentially kick-started the industry for using Java on the server, and it goes all the way back to the very beginnings of Java in 1996 with Kiva Enterprise Server (GlassFish) and the Tengah application server (the Oracle WebLogic Server ancestor). Note that here, the word Tengah refers to an administrative region in the center of the island of Java in Indonesia.

Java EE, or J2EE (Java 2 Enterprise Edition) as it was known before, is perhaps best known for its Java Servlet specification and for servers implementing that, such as Tomcat and Jetty. These are often called servlet containers. Although there are alternatives, many server applications and third-party frameworks are based on the Java Servlet specification. Besides this specification, Java EE in later years became known for its specifications for persistence (Java Persistence API [JPA], mostly via Hibernate), REST (JAX-RS), WebSocket, and a slew of smaller specifications such as for transactions (Java Transaction API [JTA], mostly used under the covers by JPA), for validation (Bean Validation), and for JSON (JSON-P and JSON-B).

In practice, some applications that might not seem to be classified as Java EE applications might use a variety of Java EE APIs.

Full implementations of Java EE, traditionally used in application servers, have enjoyed considerable success as well: JBoss/WildFly, GlassFish/Payara, and, more recently, Open Liberty (the modern successor of WebSphere) are all well known.

Then there’s a group of products that are neither application servers nor servlet containers, but do support a variety of Java EE APIs out of the box. These include Quarkus (Contexts and Dependency Injection [CDI], JAX-RS, JPA), Helidon (CDI, JAX-RS, JPA, JTA), KumuluzEE (CDI, JAX-RS, JPA, Servlet, JavaServer Faces [JSF], WebSocket, Bean Validation, JSON-P), and Piranha (CDI, JAX-RS, Java EE Security, Expression Language [EL]).

Finally there’s the Java EE offspring platform called MicroProfile, which directly depends on Java EE APIs such as CDI, JAX-RS, and JSON. All together this makes the Java EE APIs quite relevant for a large group of users.

What Has Been Going on with Java EE?


The last release of Java EE proper was Java EE 8 in August 2017. This was a scope-reduced release, although it did contain important key functionality, such as Java EE Security. Oracle decided later that year to transfer Java EE fully to an open source foundation. In coordination with Java EE partners Red Hat and IBM, it was decided to transfer Java EE along with the full reference implementation and the Technology Compatibility Kit (TCK) to the Eclipse Foundation.

Due to the enormous amount of work involved with this transfer, the process was split into three stages.

Stage 1: Transfer API and implementation code and release a verified build. The first stage involved creating a new top-level project at Eclipse called Eclipse Enterprise for Java (EE4J). The EE4J project and its associated GitHub organization, eclipse-ee4jz, are home to both the specification and implementation projects. EE4J should not be confused with the new brand name for Java EE, Jakarta EE, which was selected several months later by the community.

Before the actual transfer of all the existing source code from the Oracle repository at github.com/javaee could be done, all the code had to be cleared legally, which among other things meant potentially controversial portions had to be removed. Weighing in at many million lines of code, this was clearly no small task. Applying this legal clearing to all the historical code as well would have been simply undoable. Therefore, the first thing to note is that only the latest released versions of the code were transferred. For instance, JSF 2.3 was transferred as a snapshot from its master branch. JSF 2.2 and earlier versions remain at their original location and are not maintained or supported by the Eclipse Foundation.

After the transfer of the source code, all the code was built using Eclipse build servers, and the result was staged to a Maven repository. The API JAR files had their Maven group ID changed from javax.* to jakarta.*, indicating that they are the build artifacts produced by Eclipse. From these, a new build of GlassFish was produced, and against this build the original Java EE 8 TCK was run. After the build passed the TCK tests, proving that all the code was transferred successfully, it was released as GlassFish 5.1.

By the way, the initial release of the APIs under the Jakarta group ID are Java EE 8 certified, not Jakarta EE 8 certified. For example, jakarta.faces:jakarta.faces-api:2.3.1 is identical to javax.faces:javax.faces-api:2.3 and both are Java EE 8 certified, but the first is built from github.com/eclipse-ee4j and the latter is from github.com/javaee.

Stage 2: Transfer TCK code, set up a new specification process, define new terms, and release a rebranded build. The second stage involved transferring the TCK and building new binaries from it for Jakarta EE 8 certification. A new certification process was set up: the Jakarta EE Specification Process (JESP). Also, a new specification license was created: the Eclipse Foundation Technology Compatibility Kit license.

In this stage, new simplified and more-consistent names were created for all specifications. The new names all start with Jakarta and are followed by a simple description of the specification, avoiding inconsistent filler words such as architecture, api, and service.

The old and new terms are shown in Table 1.

Transition from Java EE to Jakarta EE
Table 1. Old Java EE 8 terms compared to new Jakarta EE 8 terms

The Javadoc for all APIs was updated in this stage to reflect the new terms, and the resulting API JAR files were relicensed and then tested against GlassFish 5.1 with the rebranded TCK that was built from the transferred TCK source code. All this was done following the new JESP specification process.

The resulting API JAR files were all released with near-empty placeholder specification documents. These combined constitute Jakarta EE 8.

For the individual JAR files, this means that this stage is the third release of technically the same API, the second release using the Maven Jakarta group ID, and the first release that’s Jakarta EE certified. Table 2 shows an example for JSF/Jakarta Faces.

Transition from Java EE to Jakarta EE
Table 2. Example showing the JAR files for JSF and Jakarta Faces

There are two extra things to notice here.

The first is that for Jakarta EE 8, there wasn’t a corresponding GlassFish release, although GlassFish 5.1 was certified for Jakarta EE 8 in addition to the existing Java EE 8 certification.

The second is that, as mentioned above, Jakarta EE 8 was released with essentially empty specification documents. The reason for this is the large amount of time it takes to legally clear and transfer those documents, and this simply was not finished in time for the Jakarta EE 8 release. For now, users (nonimplementors) of the technologies can read the evaluation version of the corresponding Java EE 8 documents.

Updating to the Jakarta EE versions of the APIs is the first small step users can take to prepare themselves for the upcoming larger changes. In a Maven project, doing that is mostly as simple as replacing this:

<dependency>
    <groupid>javax</groupid>
    <artifactid>javaee-api</artifactid>
    <version>8.0</version>
    <scope>provided</scope>
</dependency>

With this:

<dependency>
    <groupid>jakarta.platform</groupid>
    <artifactid>jakarta.jakartaee-api</artifactid>
    <version>8.0.0</version>
    <scope>provided</scope>
</dependency>

<dependency>
    <groupid>jakarta.platform</groupid>
    <artifactid>jakarta.jakartaee-api</artifactid>
    <version>8.0.0</version>
    <scope>provided</scope>
</dependency>

Or, when individual dependencies are used, replacing this:

<dependency>
    <groupid>javax.faces</groupid>
    <artifactid>javax.faces-api</artifactid>
    <version>2.3</version>
    <scope>provided</scope>
</dependency>

<dependency>
    <groupid>javax.faces</groupid>
    <artifactid>javax.faces-api</artifactid>
    <version>2.3</version>
    <scope>provided</scope>
</dependency>

<dependency>
    <groupid>javax.faces</groupid>
    <artifactid>javax.faces-api</artifactid>
    <version>2.3</version>
    <scope>provided</scope>
</dependency>

With this:

<dependency>
    <groupid>jakarta.faces</groupid>
    <artifactid>jakarta.faces-api</artifactid>
    <version>2.3.2</version>
    <scope>provided</scope>
</dependency>

<dependency>
    <groupid>jakarta.faces</groupid>
    <artifactid>jakarta.faces-api</artifactid>
    <version>2.3.2</version>
    <scope>provided</scope>
</dependency>

<dependency>
    <groupid>jakarta.faces</groupid>
    <artifactid>jakarta.faces-api</artifactid>
    <version>2.3.2</version>
    <scope>provided</scope>
</dependency>

<dependency>
    <groupid>jakarta.faces</groupid>
    <artifactid>jakarta.faces-api</artifactid>
    <version>2.3.2</version>
    <scope>provided</scope>
</dependency>

Because the APIs are essentially identical, there should be few issues after this update. Note, though, that Maven does not see the two dependencies as related with one being newer than the other.

For Maven, there are two totally different dependencies, and Maven will happily include both of them. This can happen, for instance, when a top-level dependency transitively brings in a Java EE dependency. Prior to the update to Jakarta, a transitively introduced javax.faces:javax.faces-api:2.2 would be overridden by, for example, a top-level javax.faces:javax.faces-api:2.3.

When that top-level dependency is changed to jakarta.faces:jakarta.faces-api:2.3.2, the 2.2 dependency will no longer be overridden and Maven will use them both, leading to all sorts of problems. If the transitive inclusion can’t be updated, this issue can typically be fixed by using exclusions, for example:

<dependency>
    <groupid>com.example</groupid>
    <artifactid>foo</artifactid>
    <scope>provided</scope>
    <exclusions>
        <exclusion>
            <groupid>javax.faces</groupid>
            <artifactid>javax.faces-api</artifactid>
         </exclusion>
     </exclusions>
 </dependency>


<dependency>
    <groupid>com.example</groupid>
    <artifactid>foo</artifactid>
    <scope>provided</scope>
    <exclusions>
        <exclusion>
            <groupid>javax.faces</groupid>
            <artifactid>javax.faces-api</artifactid>
         </exclusion>
     </exclusions>
 </dependency>


<dependency>
    <groupid>com.example</groupid>
    <artifactid>foo</artifactid>
    <scope>provided</scope>
    <exclusions>
        <exclusion>
            <groupid>javax.faces</groupid>
            <artifactid>javax.faces-api</artifactid>
         </exclusion>
     </exclusions>
 </dependency>


<dependency>
    <groupid>com.example</groupid>
    <artifactid>foo</artifactid>
    <scope>provided</scope>
    <exclusions>
        <exclusion>
            <groupid>javax.faces</groupid>
            <artifactid>javax.faces-api</artifactid>
         </exclusion>
     </exclusions>
 </dependency>

<dependency>
    <groupid>com.example</groupid>
    <artifactid>foo</artifactid>
    <scope>provided</scope>
    <exclusions>
        <exclusion>
            <groupid>javax.faces</groupid>
            <artifactid>javax.faces-api</artifactid>
         </exclusion>
     </exclusions>
 </dependency>

That brings me to the final step in the process.

Stage 3: Transfer and update the specification documents, prune the specifications, change the API package name, and release JDK 11. The final step of the transfer, which is currently in process and set to complete later this year, includes transferring the specification document source code (mostly in AsciiDoc). After the API code, implementation code, and TCK code, this is the final artifact to be transferred. Just like the Javadoc for the APIs, the specification documents will be updated to use the new terminology.

The highest impact item in this stage, however, is changing the package name in all the Java APIs from javax.* to jakarta.*. For instance javax.faces.context.FacesContext will become jakarta.faces.context.FacesContext. The consequence of this package name change is that code of existing applications will have to be updated, making this a nontrivial update.

Given the large amount of time that has passed since the Java EE 8 release, Jakarta EE 9 will officially require support for JDK 11. However, since JDK 8 is still so important, the APIs remain at JDK 8. Practically, this means the APIs have to be compiled with the JDK 8 source code level, but the implementations must pass the TCK running on JDK 11.

Because JDK 11 removed several specifications that had earlier been moved from Java EE into Java SE, these will now be moved back again. Jakarta Activation enters Jakarta EE as a required specification (specifically because it’s a required dependency of Jakarta Mail), while Jakarta XML Binding, Jakarta XML Web Services, Web Services Metadata, and SOAP with Attachments are added as optional specifications.

Jakarta Enterprise Beans (formerly EJB) will be reduced in size again. After entity beans (including EJB Query Language) and Java API for XML-based RPC (JAX-RPC) endpoints were pruned in EJB 3.1, it’s now time to prune the EJB 2.1 API group (for example, javax.ejb.EJBHome) and the so-called distributed interoperability.

Furthermore, the Deployment specification (JSR 88) and the Management specification (JSR 77) will be pruned as well. JSR 88 was already optional in Java EE 8, although JSR 77 was once slated for a major update; however, that failed to materialize. JAX-RPC, which was long ago superseded by JAX-WS and already optional in Java EE 8, will now finally be pruned as well, together with XML Registries, which also was already optional in Java EE 8.

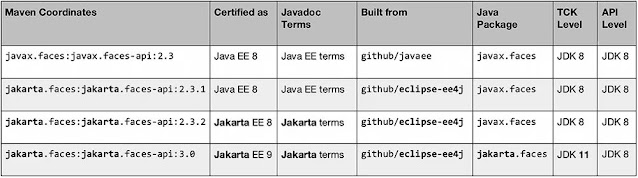
Table 3 shows the JSF/Jakarta Faces example again updated for Jakarta EE 9, and changes related to Java EE 8 are in bold. The final row is tentative and subject to change still (though unlikely).
Transition from Java EE to Jakarta EE
Table 3. JSF/Jakarta example updated for Jakarta EE 9 (view larger image)

Conclusion

After Jakarta EE 9 has been released, and presumably all specification documents have been transferred and updated, the transfer of Java EE 8 will be considered done. At that point, everything related to Java EE will have been moved to the Eclipse Foundation and updated to the new branding.

Functionally speaking, Jakarta EE 9 is still essentially the same as Java EE 8, so from a purely functional perspective, neither Jakarta EE 8 nor Jakarta EE 9 are particularly enticing for users to update to. The purpose of those releases is, however, to give the community and the ecosystem (for example, tooling and library vendors) the opportunity to prepare their applications and products. Jakarta EE 10 will be the first version in which new functionality will appear. Table 4 shows the releases and release dates (tentative dates are denoted by *).

Transition from Java EE to Jakarta EE
Table 4. Releases and release dates