Download a PDF of this article
Java Management Service (JMS) is a new cloud-based service designed to help organizations understand the Java versions installed within both test and deployment environments. Introduced in June 2021, the service provides analytics on Java running in the cloud and on-premises.
According to a post by Alexandra Huff, director of Java global marketing at Oracle, JMS offers a single console to help you manage Java deployments across the enterprise, answering questions such as
◉ What are all the Java versions installed on my environment?
◉ What versions of Java are running on development and production systems?
◉ Which JDK distribution is each of these systems using?
◉ Are any unplanned Java applications running?
◉ Are all the installed Java versions up to date with the latest security patches?
JMS offers continuous insight based on telemetry data from the JVM to analyze security, performance, compliance, and efficiency. Huff writes, “For example, normally cryptography usage is a black box; expired certificates or disabled algorithms are often found only when something breaks or after a malicious attack.” The service can look inside and report on what’s going on.
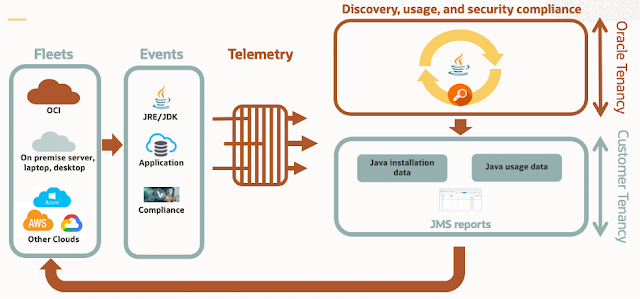
Figure 1 shows the architecture of the service. Presently, JMS supports Linux hosts only.
Figure 1. Architecture overview of Java Management Service
The monitoring service uses data provided by
Java Usage Tracker, which is available for all releases of Java 7 and later.
Java Usage Tracker tracks how Java runtime environments (JREs) are used in your systems. Java Usage Tracker output is a plain text, comma-separated record that contains the JRE version, the application being run, and other details. This record is added to a file or sent over the network in a UDP packet. Java Usage Tracker is a feature of Oracle JDK and JRE, and it is not available for OpenJDK binaries.
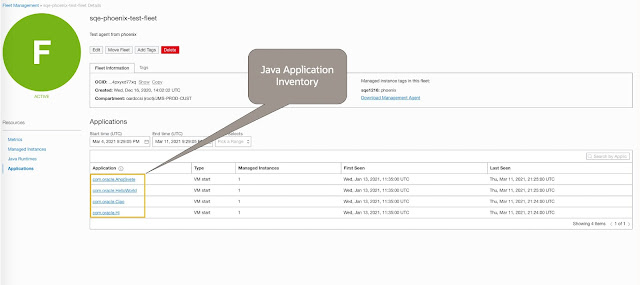
With Java Usage Tracker, JMS can track usage for Java running on Oracle Cloud Infrastructure and on on-premises desktops, laptops, and servers, as well as on any provider’s cloud services, via a telemetry agent you install on the managed instances. The system can monitor the JDK, JRE, and GraalVM. Figure 2 shows the type of information reported for Java applications.
Figure 2. Application inventory report from Java Management Service
JMS is hosted on Oracle Cloud Infrastructure. If you have an Oracle Cloud Infrastructure account, navigate to the Observability and Management section, and select Java Management Service from the menu.
The agent is installed in your Oracle Cloud Infrastructure tenancy for monitoring and producing reports. Only you can see the reports. Oracle cannot see the data and does not charge compute time for the use of the service; Oracle charges only if usage exceeds the free-tier thresholds. Telemetry data is stored in your own cloud tenancy for privacy protection.
Source: oracle.com


0 comments:
Post a Comment