One of the benefits that Eclipse provides is the ability to run code interactively by using its integrated debugger. Examining variables and expressions while executing code step-by-step is an invaluable tool for investigating problems with your code. This excerpt from Chapter 2 of Eclipse in Action: A guide for Java developers provides an introduction to creating a Java project, running a Java program, and debugging it.
Creating a Java Project
When Eclipse is first started, it is in the Resource perspective, a set of panes for managing projects, folders, files, and other resources. In Eclipse parlance, each of these panes is called a view, and a complete set of views is called a perspective. In the Resource perspective, you can navigate or create resources by using the view at the top left, the Navigator view.
Before you can do anything else in Eclipse, such as creating a Java program, you need to create a Java project. To create a new Java project, follow these steps:
1. Right-click in the Navigator view to bring up a context menu and select New->Project.
2. In the New Project dialog box, Eclipse presents the project options: Java, Plug-in Development, and Simple. Because you want to create a Java program, select Java on the left side of the dialog box.
3. Select Java Project on the right. If you've installed other types of Java development plug-ins, various other types of Java projects may potentially be listed here (EJBs and servlets, for example). But the JDT that comes standard with Eclipse only offers support for standard Java applications, so you must choose the Java Project option.
4. Click Next to start the New Java Project Wizard. (A wizard is a set of dialog boxes that prompts you through a set of well-defined, sequential steps necessary to perform a specific task. This feature is used extensively throughout Eclipse.)
5. The first dialog box prompts you for a project name. This is a simple "Hello, world" example, so enter Hello. Clicking Next would take you to a dialog box that lets you change a number of Java build settings, but for this example you don't need to change anything.
6. Click Finish.
7. Eclipse notifies you that this kind of project is associated with the Java perspective and asks whether you want to switch to the Java perspective. Check the Don't Show Me This Message Again box and click Yes.
Creating a Java class
Once you've created a project for it to live in, you can create your first Java program. Although doing so is not necessary, it's a good practice to organize your Java classes into packages. It's conventional to use a domain name as the package name because this reduces the likelihood of name collisions—that is, more than one class with exactly the same name. You can use a registered domain name if you have one, but if not, you can use any convenient, unique, ad hoc name, especially for private use. Here, we'll use org.eclipseguide. To this, add a name for this particular project: hello. All together, the package name is org.eclipseguide.hello.
Follow these steps to create your Java program:
1. Right-click on the project and select New.Class to bring up the New Java Class Wizard.
2. The first field, Source Folder, is by default the project's folder—leave this as it is.
3. Enter org.eclipseguide.hello in the Package field.
4. In the class name field, enter HelloWorld.
5. In the section Which Method Stubs Would You Like to Create?, check the box for public static void main(String[] args). The completed New Java Class dialog box is shown in Figure 1.
6. Click Finish, and the New Java Class Wizard will create the appropriate directory structure for the package (represented in the Navigator by the entry org.eclipseguide.hello under the Hello project) and the source file HelloWorld.java under this package name.
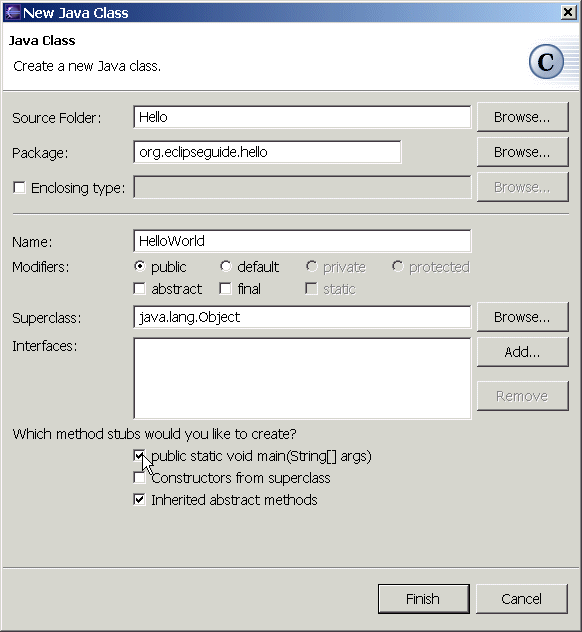
Figure 1: Creating the HelloWorld class using the New Java Class Wizard
The code that's automatically generated includes a method stub for main(). You need to add any functionality, such as printing your "Hello, world!" yourself. To make debugging more interesting, you'll add a separate method with a loop to print. Alter the code generated by Eclipse as follows:
public class HelloWorld {
public static void main(String[] args) {
say("Hello, world!");
}
public static void say(String msg) {
for (int i = 0; i < 3; i++) {
System.out.println(msg);
}
}
}
Running the Java Program
You're now ready to run this program. There are several things you might want to consider when running a Java program, including the Java runtime it should use, whether it will take any command-line parameters, and, if more than one class has a main() method, which one to use. The standard way to start a Java program in Eclipse is to select Run->Run from the Eclipse menu. Doing so brings up a dialog box that lets you configure the launch options for the program; before running a program, you need to create a launch configuration or select an existing launch configuration.
For most simple programs, you don't need a special launch configuration, so you can use a much easier method to start the program: First, make sure the HelloWorld source is selected in the editor (its tab is highlighted in blue) and then do the following from the Eclipse menu:
1. Select Run->Run As->Java Application.
2. Because you've made changes to the program, Eclipse prompts you to save your changes before it runs the program. Click OK.
3. The Task view changes to a Console view and displays your program output (see Figure 2).
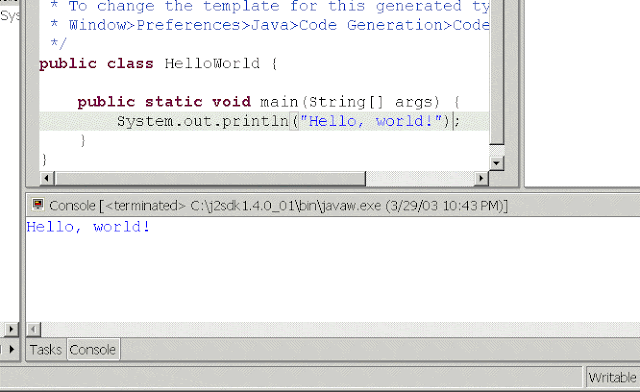
Figure 2: The Eclipse Console view displays the output from the HelloWorld program.
You may wonder why no separate step is required to compile the .java file into a .class file. This is the case because the Eclipse JDT includes a special incremental compiler and evaluates your source code as you type it. Thus it can highlight things such as syntax errors and unresolved references as you type. (Like Eclipse's other friendly features, this functionality can be turned off if you find it annoying.) If compilation is successful, the compiled .class file is saved at the same time your source file is saved.
Debugging the Java Program
Eclipse's ability to run the code interactively is one of its most powerful features. By using theJDT debugger, you can execute your Java program line by line and examine the value of variables at different points in the program, for example. This process can be invaluable in locating problems in your code.
To prepare for debugging, you need to set a breakpoint in your code so the debugger suspends execution and allows you to debug—otherwise, the program will run to completion without letting you do any debugging. To set a breakpoint, double-click in the gray margin on the left side of the editor, next to the call to say(). A blue dot will appear, indicating an active breakpoint.
Starting the program under the debugger is similar to running it. Eclipse provides two options: Use the full-service Run->Debug menu selection to use a launch configuration, or use the express Run->Debug As->Java Application selection if the default options are okay. Here, as before, you can use the latter.
Make sure the source for HelloWorld is selected in the editor and select Run->Debug As->Java Application from the main menu. Eclipse will start the program, change to the Debug perspective, and suspend execution at the breakpoint (see Figure 3).
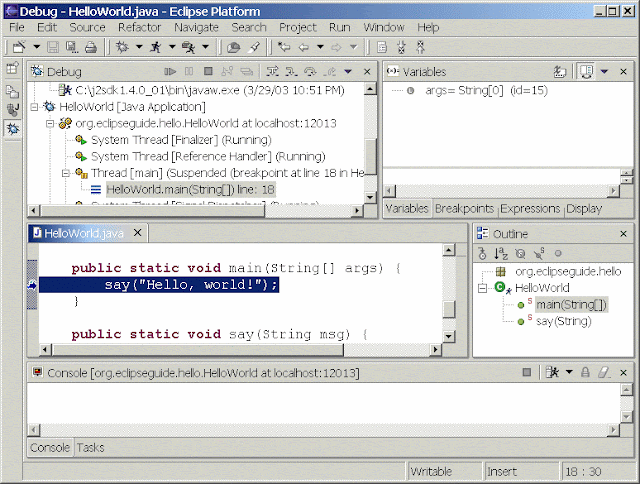
Figure 3: Debugging HelloWorld: Execution is suspended at the first breakpoint.
The Debug perspective includes several new views that are, not surprisingly, especially useful for debugging. First, at top left, is the Debug view (not to be confused with the Debug perspective to which it belongs), which shows the call stack and status of all current threads, including any threads that have already run to completion. Your program, which Eclipse started, has hit a breakpoint, and its status is shown as Suspended.
Stepping through code
In the title bar of the Debug view is a toolbar that lets you control the program's execution. The first few tool buttons, which resemble the familiar controls of electronic devices such as CD players, allow you to resume, suspend, or terminate the program. Several buttons incorporate arrows in their design; these allow you to step through a program a line at a time. Holding the mouse over each button in turn will cause tool tips to appear, identifying them as Step With Filters, Step Into, Step Over, Step Return, and so on.
For example, click the second step button, Step Into. Doing so executes the line of code that is currently highlighted in the editor area below the Debug view: the call to the say() method. Step Into, as the name suggests, takes you into the method that is called. After clicking Step Into, the highlighted line is the first executable line in say()—the for statement.
The Step With Filters button works the same as Step Into, but it's selective about what methods it will step into. You normally want to step only into methods in your own classes and not into the standard Java packages or third-party packages. You can specify which methods Step Filter will execute and return from immediately by selecting Window.Preferences.Java.Debug.Step Filtering and defining step filters by checking the packages and classes listed there. Taking a moment to set these filters is well worth the trouble, because Step With Filters saves you from getting lost deep in unknown code—something that can happen all too often when you use Step Into.
Evaluating variables and expressions
To the right of the Debug view is a tabbed notebook containing views that let you examine and modify variables and breakpoints. Select the Variables tab (if it isn't already selected). This view shows the variables in the current scope and their values; before entering the for loop, this view includes only the say() method's msg parameter and its value, "Hello, world!" Click either Step Over or Step Into to enter the for loop. (Both have the same effect here, because you don't call any methods in this line of code.) The Variables view will display the loop index i and its current value, 0.
Sometimes a program has many variables, but you're interested in only one or a few. To watch select variables or expressions, you can add them to the watch list in the Expression view. To do this, select a variable—i, for instance—by double-clicking on it in the editor, and then right-clicking on the selection and choosing Watch from the context menu. The variable (and its value, if it's in scope) will appear in the Expressions view.
One significant advantage of watching variables in the Variables and Expressions views over using print statements for debugging is that you can inspect objects and their fields in detail and change their values—even normally immutable strings. Return to the Variables view and expand the msg variable to show its attributes. One of these is a char array, value, which can be expanded to reveal the individual characters in the msg String. For example, double-click on the character H, and you will be prompted to enter a new value, such as J.
The Display view is in the same tabbed notebook. It allows you to enter any variables that are in scope, or arbitrary expressions including these variables. Select Display view and enter the following, for example:
msg.charAt(i)
To immediately evaluate this expression, you must first select it and then click the second Display view tool button (Display Result of Evaluating Selected Text), which displays the results in the Display view. It's usually better to click the first tool button (Inspect Result of Evaluating Selected Text), because it adds the expression to the Expressions view. Either way, the value displayed is not automatically updated as the variables in the expression change; but in the Expressions view, you have the option of converting the expression into a watch expression, which is updated as you step through the code. To do this, change to the Expressions view. Notice that the Inspect icon (a magnifying glass) appears next to the expression. Click on the expression and select Convert to Watch Expression from the context menu. The icon next to the expression will change to the Watch icon.
Let's go back to stepping through the code. You previously left the cursor at the call to System.out.println(). If you want to see the code for System.out.println(), you can click Step Into; otherwise, click Step Over to execute the System.out.println() method and start the next iteration of the for loop.
Below the editor area is another tabbed notebook, which includes a Console view. Program output appears here; if you made the earlier change to the variable msg, the line "Jello, world!" will appear. You can either continue to click Step Over until the loop terminates or, if you find this process tedious, click Step Return to immediately finish executing the say() method and return to the main() method. Or, just click the Resume button to let the program run to the end.


0 comments:
Post a Comment