Use the HotSpot Disassembler to see what’s happening to your code.
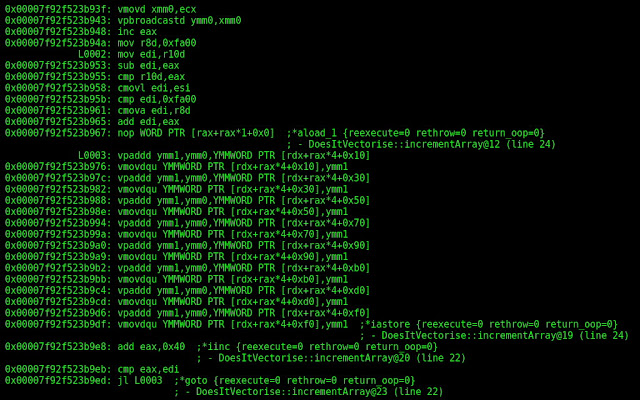
Figure 1 below is what you might see when you ask your Java Virtual Machine (JVM) to show you the output of a just-in-time (JIT) compilation performed by the HotSpot JVM after it optimized your program to take advantage of the powerful features in your CPU.
Figure 1. An image of disassembled Java native code
This output comes from a library called hsdis (HotSpot Disassembler). It’s a plugin for the HotSpot JVM, Oracle’s default JVM for Java, which provides disassembly of JIT-compiled native code back into human-readable assembly language code.
There’s a lot to unpack here so let’s start with a refresher on how HotSpot executes Java programs.
Once you have written a program in Java, and before you can run it, you must compile the program’s Java source code into bytecode, the language of the JVM. This compilation can happen in your IDE, via your build tools (such as Maven or Gradle), or via command-line tools such as javac.
The bytecode is written into class files. When you run the program, the class files are loaded into the JVM, and then the bytecode is executed by the JVM’s bytecode interpreter.
While the JVM is running your program, the JVM also profiles the application in real-time order to decide which parts are performed a lot (the hot spots) and might benefit from being compiled from bytecode into native code for the CPU on which your JVM is running.
This transformation from interpreted bytecode into native execution on your CPU is performed at runtime and is known as JIT compilation, in contrast to ahead-of-time (AOT) compilation used by languages such as C/C++. One of the advantages of JIT compilation over AOT compilation is the ability to optimize based on observed behavior at runtime, which is known as profile-guided optimization (PGO).
HotSpot JIT compilation isn’t your only choice, of course. Java programs can also be AOT-compiled using the GraalVM Native Image technology, which might be of interest to you if faster startup time and lower runtime memory overhead are important to you, such as in a serverless microservices environment.
Because JIT compilation happens at runtime, the compilation process consumes CPU and memory resources that might otherwise be used by the JVM to run your application. That means there’s a performance cost that is not present with AOT-compiled binaries.
For the rest of this article, I’ll discuss JIT compilation using HotSpot, examining exactly how that process works.
Java client and Java server
HotSpot contains two separate JIT compilers. The first is C1 (often called the client compiler); the other is C2 (the server compiler):
◉ The C1 compiler begins working quickly and uses fast, simple optimizations to help boost application startup time. In other words, your program starts up faster.
◉ The C2 compiler spends longer collecting the profiling information needed to support more-advanced optimization techniques. Thus, your program takes a little longer to start up but will usually run faster once it has started.
The “client” and “server” parts of the names were assigned during a time in Java’s history when the performance characteristics of a typical end user device (such as a PC or laptop) and a server were very different. For example, back in the days of Java 5, the 32-bit Windows Java Runtime Environment (JRE) distribution contained only the C1 compiler because a typical desktop PC might have only one or two CPU threads. In that era, slowing the startup of a desktop program’s execution to perform advanced C2 optimizations would have a negative effect on the end user’s experience.
Today, end user devices are closer to servers in their processing power. Recently, the default behavior of the JVM has been to combine the strengths of both C1 and C2 in a mode known as tiered compilation, which gives the benefits of the faster optimizations of C1 and the higher peak performance of C2.
Tiered compilation can be controlled using the -XX:+TieredCompilation and -XX:-TieredCompilation switches.
How the HotSpot JIT compilers work
The discussion below summarizes how the HotSpot JIT compilers work and provides enough depth for the purposes of this article. If you want to probe more deeply, you can view the HotSpot compiler source code’s compilation policy.
The basic unit of JIT compilation is the method, and the JVM will use invocation counters to discover which methods are being called most frequently. These are termed the hot methods.
The JIT system can operate at a unit smaller than a whole method when it observes a loop with many back branches, meaning the loop reaches the end of its body and decides it has not finished and needs to jump back to the start for another iteration. When the number of back branches (known as the loop back-edge counter) reaches a threshold, the JIT system can replace the interpreted loop bytecode with a JIT-compiled version. This is known as an on-stack replacement (OSR) compilation.
The code cache. Native code produced by the JIT compilers is stored in a memory region of the JVM called the code cache. Prior to JDK 9, the code cache was a single contiguous piece of memory where the following three main types of native code found in the JVM were stored together:
◉ Profiled code
◉ Nonprofiled (fully optimized) code
◉ JVM internal code
The nonsegmented code cache size was controlled by the -XX:ReservedCodeCacheSize=n switch.
Beginning with JDK 9, the code cache layout was improved by JEP 197 (Segmented code cache). This JEP splits the cache into three regions, depending on the three native code types, to reduce fragmentation and better manage the native code footprints. The segmented code cache sizes are controlled by the following three switches:
◉ -XX:NonProfiledCodeHeapSize=n sets the size in bytes of the code heap containing nonprofiled methods.
◉ -XX:ProfiledCodeHeapSize=n sets the size in bytes of the code heap containing profiled methods.
◉ -XX:NonMethodCodeHeapSize=n sets the size in bytes of the code heap containing nonmethod code.
JEP draft 8279184 (named “Instruction issue cache hardware accommodation”) aims to improve the code cache performance even further.
JIT compilation without tiered compilation. Table 1 shows the thresholds for triggering method compilation on x86 systems if tiered compilation is disabled.
Table 1. Triggering thresholds
Compiler Invocations
C1 1,500
C2 10,000
The invocation threshold can be controlled using the -XX:CompileThreshold=n switch. If you wish to control the thresholds for OSR compilation, you can express the back-edge trigger as a percentage of the CompileThreshold value using the -XX:OnStackReplacePercentage=n switch.
JIT with tiered compilation. When tiered compilation is enabled (it’s been the default since JDK 8), the JIT system will use the five tiers of optimization shown in Table 2. A method may end up being JIT-compiled multiple times at different tiers as the JVM better understands the method's usage through profiling.
Table 2. Tiers of optimization
The trigger thresholds at each tier on a typical Linux x86 system are as follows:
◉ The tier 2 compile threshold is 0.
◉ The tier 3 invocation threshold is 200.
◉ The tier 3 compile threshold is 2,000.
◉ The tier 4 invocation threshold is 5,000.
◉ The tier 4 compile threshold is 15,000.
Some typical compilation sequences are shown in Table 3.
Table 3. Typical compilation sequences
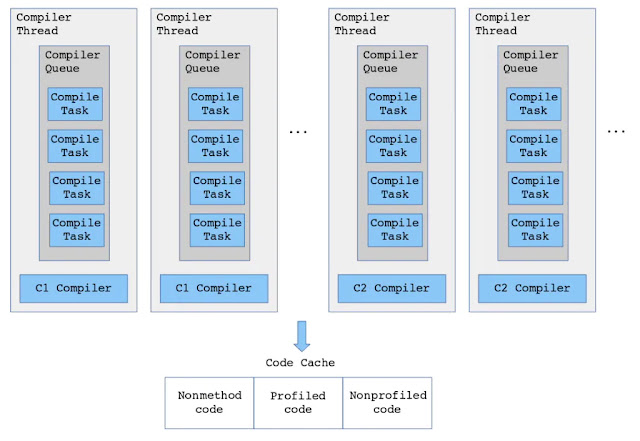
Compiler threads. The JVM allows you to control the number of JIT compiler threads with the -XX:CICompilerCount=n switch. Each compiler thread contains a queue, and when a method or loop reaches a compilation threshold, a compilation task will be created and inserted into one of the compiler queues. When a compilation task is removed from the queue, it is passed to the JIT compiler for transformation into optimized native code that is stored in the code cache. See Figure 2 for details.
Figure 2. Compilation tasks in the JIT compiler queues
The role of the HotSpot Disassembler
The OpenJDK HotSpot creators added a feature that allows developers to inspect the native code that is created by the JIT compilers and stored in the code cache. However, this compiled code is in binary format ready for execution by the CPU, so it is not human-readable code.
Fortunately, you can use hsdis, the HotSpot Disassembler, to turn that native code back into a human-readable assembly language code.
When the JVM starts up, it checks for the presence of the hsdis library and if it’s found, the JVM will allow you to use additional switches to control the disassembly output for various types of native code. These hsdis switches are all categorized as diagnostic, so you must first unlock them using the -XX:+UnlockDiagnosticVMOptions switch.
Once they are unlocked, you can request disassembly output by using the switches shown in Table 4.
Table 4. Switches for requesting disassembly output
Note that when it’s enabled, hsdis is invoked after each blob of native code is inserted into the code cache. The process of disassembling the native code (which can be quite sizable if extensive inlining occurred) instruction by instruction into human-readable assembly language code (a large chunk of text) and writing that text to the console or a log file is a fairly expensive operation best done in your development environment and not in production.
By the way, if you wish to see only the disassembly of specific methods, you can control the output via the -XX:CompileCommand switch. For example, to output the assembly language code for the method length() in java.lang.String you would use
java -XX:+UnlockDiagnosticVMOptions -XX:CompileCommand=print,java/lang/String.length
Building hsdis. The hsdis source files found in the OpenJDK repository are wrapper code. The actual disassembly is performed by external libraries found within the GNU Binutils project.
Let’s say you want to build hsdis using OpenJDK 17 and binutils version 2.37. The hsdis plugin must be compiled for each operating system on which you wish to use it. The hsdis build process will produce a file in the dynamic library format for each operating system, as shown in Table 5.
Table 5. File formats according to OS
These instructions assume that you have a working UNIX-like build environment available. If you would prefer to use a prebuilt hsdis plugin as a binary for your operating system and architecture, I’ve built them for your convenience. Download them here, and see Figure 3 for the options.
Figure 3. The prebuilt hsdis binaries
Want to build your own? Here’s what to do.
◉ Download binutils-2.37 here.
◉ Unpack the binutils download using the tar -xzf binutils-2.37.tar.gz command. The build examples below assume you’re unpacking into your home directory.
◉ Clone the OpenJDK 17 source code from GitHub by using git clone.
Note that on recent JDKs, the hsdis files are in the folder <jdk>/src/utils/hsdis.
Below are some specific builds.
Building on Linux (amd64). Perform the following steps:
cd jdk17/src/utils/hsdis
make BINUTILS=~/binutils-2.37 ARCH=amd64
# Produces build/linux-amd64/hsdis-amd64.so
Building on Linux (32-bit ARM such as the Raspberry Pi v1 or v2). Perform the following steps:
cd jdk17/src/utils/hsdis
make BINUTILS=~/binutils-2.37 ARCH=arm
# Produces build/linux-arm/hsdis-arm.so
Building on Linux (64-bit ARM such as the Raspberry Pi v3, v4, or 400). Perform the following steps:
cd jdk17/src/utils/hsdis
make BINUTILS=~/binutils-2.37 ARCH=aarch64
# Produces build/linux-aarch64/hsdis-aarch64.so
Building on macOS (amd64). Perform the following steps:
cd jdk17/src/utils/hsdis
make BINUTILS=~/binutils-2.37 ARCH=amd64
# Produces build/macosx-amd64/hsdis-amd64.dylib
Building on MacOS (ARM M1). Perform the following steps:
cd jdk17/src/utils/hsdis
make BINUTILS=~/binutils-2.37 ARCH=aarch64
# Produces build/macosx-aarch64/hsdis-aarch64.dylib
Building on Windows (using Cygwin and MinGW). Building hsdis on Windows is more involved and uses the Cygwin tools, which provide a Linux-like build environment. The following steps have been tested on Windows 10.
First, download and install Cygwin using the installer found here.
Then, install the following additional packages:
gcc-core 11.2.0-1
mingw64-x86_64-gcc-core 11.2.0-1
mingw64-x86_64-gcc-g++ 11.2.0-1
make 4.3-1
If you didn’t select these packages at installation time, rerun the installer to select additional packages.
Then to build a Windows 64-bit DLL file, perform the following step:
make OS=Linux MINGW=x86_64-w64-mingw32 BINUTILS=~/binutils-2.37/ ARCH=amd64
# Produces build/Linux-amd64/hsdis-amd64.dll
Alternatively, to build a Windows 32-bit DLL file, perform the following step:
make OS=Linux MINGW=x86_64-w64-mingw3 BINUTILS=~/binutils-2.37/ ARCH=i386
# Produces build/Linux-i586/hsdis-i386.dll
Installing hsdis
Now that you have built or downloaded hsdis, you must put it in a place where the JVM can find it. The following JDK paths are searched:
<JDK_HOME>/lib/server/hsdis-<arch>.<extension>
<JDK_HOME>/lib/hsdis-<arch>.<extension>
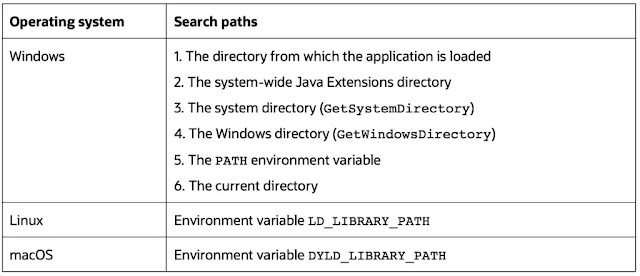
Additionally, the paths shown in Table 6 are searched on each operating system.
Table 6. Additional search paths
Hint: I recommend using an environment variable to point to hsdis. This saves you from having to copy the binary into every JDK you use.
Experimenting in the JITWatch sandbox
If you have experience with C++, you may be familiar with the Compiler Explorer by Matt Godbolt, which lets you test snippets of C++ code using various AOT compilers and view the native code that’s produced.
In the Java world you can do something similar with a tool I’ve written called JITWatch. JITWatch processes the JIT compilation logs that are output by the JVM and explains the optimization decisions made by the JIT compilers.
JITWatch has a sandbox mode in which you can experiment with Java programs in a built-in editor, and then you can click a single button to compile and execute your programs—and inspect the JIT behavior in the main JITWatch user interface. I will use the sandbox to illustrate and explain the output of hsdis. Figure 4 shows the rapid feedback loop with JITWatch.
Figure 4. Rapid feedback loop for JIT experimentation with JITWatch
Installing JITWatch. Download the latest release (at the time of writing, it’s version 1.4.7) from my GitHub repo or build from source code using the following:
git clone https://github.com/AdoptOpenJDK/jitwatch.git
cd jitwatch
mvn clean package
# Produces an executable jar in ui/target/jitwatch-ui-shaded.jar
Run JITWatch with the following command:
java -jar <path to JITWatch jar>
The sandbox comes with a set of examples that exercise various JIT optimizations.
An assembly language primer
Before looking at the assembly language code from an example Java program in JITWatch, here’s a short primer in Intel x86-64 assembly language. For this platform, each disassembled instruction in assembly language takes the following form:
<address> <instruction mnemonic> <operands>
◉ The address is shown for identifying the target of a jump instruction.
◉ The mnemonic is the short name for the instruction.
◉ The operands can be registers, constants, addresses, or a mixture (in the case of offset addressing).
Note that by default hsdis outputs a format known as AT&T assembly, which orders the instructions as follows:
<mnemonic> <src> <dst>
But you can switch to the following Intel format by using the JVM’s -XX:PrintAssemblyOptions=intel switch:
<mnemonic> <dst> <src>
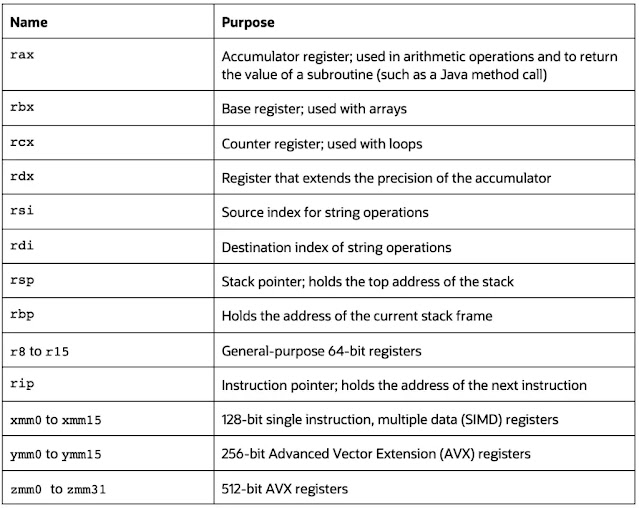
x86-64 register naming. There are many resources describing the x86-64 architecture. The official software developer’s manuals for the Intel 64 and IA-32 architectures are almost 5,000 pages! For the purpose of gaining a basic understanding of the hsdis output, Table 7 shows some of the commonly used registers and their purposes.
Table 7. Commonly used registers
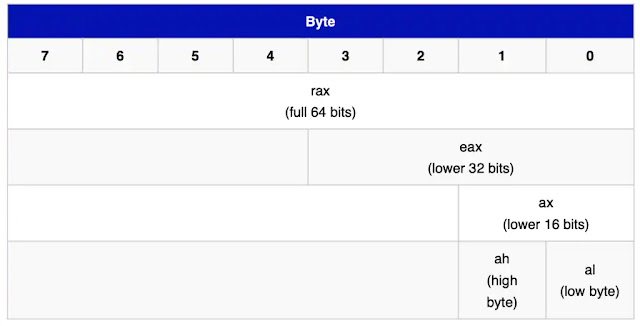
Note that the rax, rbx, rcx, and rdx registers can be accessed in 32-, 16-, and 8-bit modes by referring to them as shown in Figure 5. When it’s dealing with the Java int type (32 bits), the accumulator will be accessed as eax, and when it’s dealing with the Java long type (64 bits), the accumulator will be accessed as rax.
Figure 5. The rax and eax registers
Registers r8 to r15 can be also accessed in 32-, 16-, and 8-bit modes using a suffix; see Figure 6.
Figure 6. The r8 register
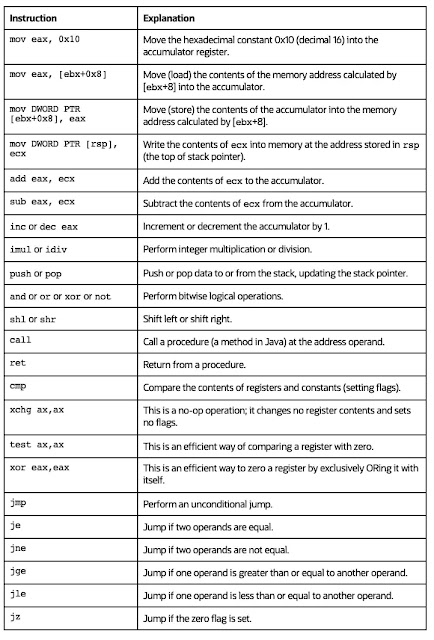
Common instructions. Table 8 shows some commonly encountered assembly language instructions and their meaning. This information is in the Intel format.
Table 8. Common assembly language instructions
There is an excellent post on Stack Overflow explaining the benefits behind several nonobvious assembly language idioms.
Using JITWatch to inspect native code
It’s time to run some Java code and inspect the disassembled JIT output. The following example is a simple program that tests whether the JIT compilers can optimize a simple loop that modifies an array. The code creates an array of 1,024 int elements and uses the incrementArray(int[] array, int constant) method to access each element of the array in order, adding a constant to the value of each array element and storing it back in the array.
Here is the source code.
public class DoesItVectorise
{
public DoesItVectorise()
{
int[] array = new int[1024];
for (int i = 0; i < 1_000_000; i++)
{
incrementArray(array, 1);
}
for (int i = 0; i < array.length; i++)
{
System.out.println(array[i]);
}
}
public void incrementArray(int[] array, int constant)
{
int length = array.length;
for (int i = 0; i < length; i++)
{
array[i] += constant;
}
}
public static void main(String[] args)
{
new DoesItVectorise();
}
}
The Java bytecode for the incrementArray method is the following:
0: aload_1 // load the reference of 'array'
1: arraylength // call the 'arraylength' instruction to get the length of the array
2: istore_3 // store the array length into local variable 3 'length'
3: iconst_0 // push int 0 onto the stack
4: istore 4 // store into local variable 4 'i'
6: iload 4 // load local variable 4 'i' and push onto the stack
8: iload_3 // load local variable 3 'length' and push onto the stack
9: if_icmpge 26 // if (i >= length) jump to BCI 26 (return)
12: aload_1 // else load the reference of 'array' and push onto the stack
13: iload 4 // load local variable 4 'i' and push onto the stack
15: dup2 // duplicate the top 2 values on the stack
16: iaload // load the value of array[i] and push onto the stack
17: iload_2 // load local variable 2 'constant' and push onto the stack
18: iadd // add array[i] and 'constant' and push result onto stack
19: iastore // store the result back into array[i]
20: iinc 4, 1 // increment local variable 4 'i' by 1
23: goto 6 // jump back to BCI 6
26: return
The bytecode is a faithful representation of the Java source code with no optimizations performed.
The class to be tested is called DoesItVectorise, and it asks whether the JIT can identify an opportunity to use the features of a modern CPU to vectorize the program so that it can update more than one array element per loop iteration using the wide SIMD registers.
These registers can pack multiple 32-bit int elements into a single register and modify them all with a single CPU instruction, thereby completing the array update with fewer loop iterations.
The incrementArray method is called 1 million times, which should be enough for the JIT compiler to obtain a good profile of how the method behaves.
I’ll load this program into the JITWatch sandbox and see what happens on my Intel i7-8700 CPU. This chip supports the Intel SSE4.2 and AVX2 instruction sets, which means the xmm 128-bit and ymm 256-bit registers should be available for a vectorization optimization.
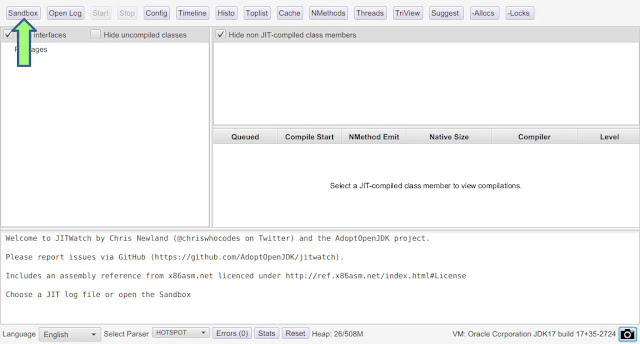
Step 1: Start JITWatch and open the sandbox, as shown in Figure 7.
Figure 7. The main JITWatch interface
Step 2: Open DoesItVectorise.java from the samples and click Run. Note that if hsdis is not detected, JITWatch will offer to download it for the current OS and architecture. See Figure 8.
Figure 8. The JITWatch sandbox interface showing the code example
Step 3: After execution is complete, locate the JITWatch main window and inspect the compilations of the incrementArray method. On my computer, that method was JIT-compiled four times before reaching its final state of optimization—and that all happened in the first 100 milliseconds of the program’s execution. See Figure 9.
Figure 9. The method was compiled four times.
Step 4: Switch to the three-view screen and ensure that the final (fourth, on my system) compilation is selected. If hsdis is correctly installed on your system, you will see the disassembly output for the incrementArray method, as shown in Figure 10.
Figure 10. The JITWatch three-view screen showing source, bytecode, and assembly language code
Understanding the JITWatch output
When the HotSpot JIT compiler creates the native code, it includes comments that help someone reading the disassembled code to relate it back to the original program. These comments include bytecode index (BCI) references, which allow JITWatch to relate assembly language instructions to the bytecode of the program. The Java class file format contains a LineNumberTable data structure that JITWatch uses to map the bytecode instructions back to the Java source code.
On entry, register rdx points to the int[] object named array, while rcx contains the int value named constant, as follows:
# {method} {0x00007f92cb000410} 'incrementArray' '([II)V' in 'DoesItVectorise'
# this: rsi:rsi = 'DoesItVectorise'
# parm0: rdx:rdx = '[I'
# parm1: rcx = int
The native code performs a stack bang test to ensure sufficient stack space is available; it does this by attempting to store the contents of eax at a fixed offset from the stack pointer rsp. (If this address falls within a guard page, a StackOverflowException will be thrown.)
[Verified Entry Point]
0x00007f92f523b8c0: mov DWORD PTR [rsp-0x14000],eax
The code then loads the array length (an int) into register ebx. With the -XX:+UseCompressedOops switch enabled, the array object header consists of a 64-bit mark word and a compressed 32-bit klass word, so the array length field is found after these two values at offset [rdx + 12 (0xc) bytes]. (A klass word in an object header points to the internal type metadata for the object.)
0x00007f92f523b8cc: mov ebx,DWORD PTR [rdx+0xc] ; implicit exception: dispatches to 0x00007f92f523ba71
;*arraylength {reexecute=0 rethrow=0 return_oop=0}
; - DoesItVectorise::incrementArray@1 (line 20)
The next code tests whether the array length in ebx is 0. If it is, execution jumps to the end of this procedure to clean up and return.
0x00007f92f523b8cf: test ebx,ebx
0x00007f92f523b8d1: jbe L0007 ;*if_icmpge {reexecute=0 rethrow=0 return_oop=0}
; - DoesItVectorise::incrementArray@9 (line 22)
What you will see next is the assembly language code representing the HotSpot loop unrolling optimization. To reduce array bounds checking, the loop is split into the following three parts:
◉ A preloop sequence
◉ A main unrolled loop performing most of the iterations with no bounds checking
◉ A postloop to complete any final iterations
The next section shows the setup and preloop sequence.
0x00007f92f523b8d7: mov ebp,ebx
0x00007f92f523b8d9: dec ebp
0x00007f92f523b8db: cmp ebp,ebx
0x00007f92f523b8dd: data16 xchg ax,ax
0x00007f92f523b8e0: jae L0008
0x00007f92f523b8e6: mov r11d,edx
0x00007f92f523b8e9: shr r11d,0x2
0x00007f92f523b8ed: and r11d,0x7
0x00007f92f523b8f1: mov r10d,0x3
0x00007f92f523b8f7: sub r10d,r11d
0x00007f92f523b8fa: and r10d,0x7
0x00007f92f523b8fe: inc r10d
0x00007f92f523b901: cmp r10d,ebx
0x00007f92f523b904: cmovg r10d,ebx
0x00007f92f523b908: xor esi,esi
0x00007f92f523b90a: xor eax,eax ;*aload_1 {reexecute=0 rethrow=0 return_oop=0}
; - DoesItVectorise::incrementArray@12 (line 24)
L0000: add DWORD PTR [rdx+rax*4+0x10],ecx ;*iastore {reexecute=0 rethrow=0 return_oop=0}
; - DoesItVectorise::incrementArray@19 (line 24)
0x00007f92f523b910: mov r9d,eax
0x00007f92f523b913: inc r9d ;*iinc {reexecute=0 rethrow=0 return_oop=0}
; - DoesItVectorise::incrementArray@20 (line 22)
0x00007f92f523b916: cmp r9d,r10d
0x00007f92f523b919: jge L0001 ;*if_icmpge {reexecute=0 rethrow=0 return_oop=0}
; - DoesItVectorise::incrementArray@9 (line 22)
0x00007f92f523b91b: mov eax,r9d
0x00007f92f523b91e: xchg ax,ax
0x00007f92f523b920: jmp L0000
L0001: mov r10d,ebx
0x00007f92f523b925: add r10d,0xffffffc1
0x00007f92f523b929: mov r11d,0x80000000
0x00007f92f523b92f: cmp ebp,r10d
0x00007f92f523b932: cmovl r10d,r11d
0x00007f92f523b936: cmp r9d,r10d
0x00007f92f523b939: jge L0009
The next two instructions show the loop is going to be vectorized, as follows:
◉ The value of the 32-bit int constant in general purpose register ecx is now pasted four times across the 128-bit SIMD register xmm0 using the vmovd instruction.
◉ Then, using the vpbroadcastd instruction, the contents of 128-bit register xmm0 are broadcast into 256-bit SIMD register ymm0, which now contains eight copies of the value of constant.
0x00007f92f523b93f: vmovd xmm0,ecx
0x00007f92f523b943: vpbroadcastd ymm0,xmm0
More unrolling setup is next.
0x00007f92f523b948: inc eax
0x00007f92f523b94a: mov r8d,0xfa00
L0002: mov edi,r10d
0x00007f92f523b953: sub edi,eax
0x00007f92f523b955: cmp r10d,eax
0x00007f92f523b958: cmovl edi,esi
0x00007f92f523b95b: cmp edi,0xfa00
0x00007f92f523b961: cmova edi,r8d
0x00007f92f523b965: add edi,eax
0x00007f92f523b967: nop WORD PTR [rax+rax*1+0x0] ;*aload_1 {reexecute=0 rethrow=0 return_oop=0}
; - DoesItVectorise::incrementArray@12 (line 24)
Here is the unrolled part of the loop, which performs vectorized array addition using the vpaddd and vmovdqu instructions.
◉ vpaddd performs packed integer addition between ymm0 (containing eight copies of constant) and eight int values read from the array, storing the result in 256-bit SIMD register ymm1.
◉ vmovdqu stores the eight incremented packed integers in ymm1 back to their locations in the array.
Between label L0003 and the jl back branch, this pair of instructions appears eight times. So through vectorization and loop unrolling, an impressive 64 array elements are updated per iteration of the main loop section.
The instruction add eax,0x40 confirms that the array offset in eax is incremented by 64 (0x40) at the end of each unrolled loop iteration.
L0003: vpaddd ymm1,ymm0,YMMWORD PTR [rdx+rax*4+0x10]
0x00007f92f523b976: vmovdqu YMMWORD PTR [rdx+rax*4+0x10],ymm1
0x00007f92f523b97c: vpaddd ymm1,ymm0,YMMWORD PTR [rdx+rax*4+0x30]
0x00007f92f523b982: vmovdqu YMMWORD PTR [rdx+rax*4+0x30],ymm1
0x00007f92f523b988: vpaddd ymm1,ymm0,YMMWORD PTR [rdx+rax*4+0x50]
0x00007f92f523b98e: vmovdqu YMMWORD PTR [rdx+rax*4+0x50],ymm1
0x00007f92f523b994: vpaddd ymm1,ymm0,YMMWORD PTR [rdx+rax*4+0x70]
0x00007f92f523b99a: vmovdqu YMMWORD PTR [rdx+rax*4+0x70],ymm1
0x00007f92f523b9a0: vpaddd ymm1,ymm0,YMMWORD PTR [rdx+rax*4+0x90]
0x00007f92f523b9a9: vmovdqu YMMWORD PTR [rdx+rax*4+0x90],ymm1
0x00007f92f523b9b2: vpaddd ymm1,ymm0,YMMWORD PTR [rdx+rax*4+0xb0]
0x00007f92f523b9bb: vmovdqu YMMWORD PTR [rdx+rax*4+0xb0],ymm1
0x00007f92f523b9c4: vpaddd ymm1,ymm0,YMMWORD PTR [rdx+rax*4+0xd0]
0x00007f92f523b9cd: vmovdqu YMMWORD PTR [rdx+rax*4+0xd0],ymm1
0x00007f92f523b9d6: vpaddd ymm1,ymm0,YMMWORD PTR [rdx+rax*4+0xf0]
0x00007f92f523b9df: vmovdqu YMMWORD PTR [rdx+rax*4+0xf0],ymm1 ;*iastore {reexecute=0 rethrow=0 return_oop=0}
; - DoesItVectorise::incrementArray@19 (line 24)
0x00007f92f523b9e8: add eax,0x40 ;*iinc {reexecute=0 rethrow=0 return_oop=0}
; - DoesItVectorise::incrementArray@20 (line 22)
0x00007f92f523b9eb: cmp eax,edi
0x00007f92f523b9ed: jl L0003 ;*goto {reexecute=0 rethrow=0 return_oop=0}
; - DoesItVectorise::incrementArray@23 (line 22)
The rest of the assembly language code (which I have omitted for conciseness) contains the postloop iterations and the assembly language epilogue used to clean up the stack and return. Note that there is no return value from the incrementArray method.
Source: oracle.com








0 comments:
Post a Comment