The best HotSpot JVM options and switches for Java 11 through Java 17
In this article, you will learn about some of the systems within the OpenJDK HotSpot Java Virtual Machine (HotSpot JVM) and how they can be tuned to best suit your program and its execution environment.
The HotSpot JVM is an amazing and flexible piece of technology. It is available as a binary release for every major operating system and CPU architecture from the tiny Raspberry Pi Zero all the way up to “big iron” servers containing hundreds of CPU cores and terabytes of RAM. With OpenJDK being an open source project, the HotSpot JVM can be compiled for almost any other system—and it can be fine-tuned using options, switches, and flags.
First, here’s some background. The language of the HotSpot JVM is bytecode. At the time of this writing, there are more than 30 programming languages that can be compiled into HotSpot JVM–compatible bytecode, but by far the most popular, with over 8 million developers worldwide, is, of course, Java.
Java source code is compiled into bytecode (as shown in Figure 1), in the form of class files, using the javac compiler. In modern development this is likely abstracted away by build tools such as Maven, Gradle, or an IDE-based compiler.
Figure 1. Process for compiling bytecode
The bytecode representation of a program is executed by the HotSpot JVM on a virtual stack machine that knows as many as 256 different instructions, and each instruction is identified by an 8-bit numerical opcode; hence, the name bytecode.
The bytecode program is executed by an interpreter that fetches each instruction, pushes its operands onto the stack, and then executes the instruction, removing the operands and leaving the result on the stack, as shown in Figure 2.
Figure 2. Results on the stack after the interpreter executes the bytecode
The abstraction of program execution from the underlying environment is what gives Java its “Write once, run anywhere” portability advantage. Class files compiled on one architecture can execute on a HotSpot JVM running on a completely different architecture.
If you’re thinking that this abstraction from the underlying hardware comes at a performance cost, you are correct. That’s often where the switches, options, and flags come in.
Just-in-time compilation
How can programs written in portable, feature-rich, high-level languages such as Java challenge the performance of those compiled to architecture-specific native code from lower-level, less-programmer-friendly languages such as C?
The answer is that the HotSpot JVM contains performance-boosting just-in-time (JIT) compilation technology that profiles your program’s execution and selectively optimizes the parts it decides will benefit the most. These are known as your program’s hot spots (hence, the name of the HotSpot JVM), and it does this by compiling them into native code on the fly using knowledge of the underlying system architecture.
The HotSpot JVM contains two JIT compilers, known as C1 (the client compiler) and C2 (the server compiler), which offer different optimization trade-offs.
◉ C1 offers fast, simple optimizations.
◉ C2 offers advanced optimizations that require more profiling and are more expensive to apply.
Ever since the release of JDK 8, the default behavior has been to use both compilers together in a mode called tiered compilation, where C1 provides rapid speed boosts while C2 gathers enough profiling information before making its advanced optimizations. The native code produced is stored in a memory region of the HotSpot JVM called the code cache, as shown in Figure 3.
Figure 3. The Java compilation process
Taking out the trash
In addition to JIT technology, the HotSpot JVM also includes productivity- and performance-boosting features such as multithreading and automatic memory management with a choice of garbage collection (GC) strategies.
Objects are allocated in a memory region of the HotSpot JVM called the heap, and once those objects are no longer referenced, they can be cleaned up by the garbage collector and the memory they used is reclaimed.
The ergonomic HotSpot JVM
With so much flexibility and dynamic behavior in the HotSpot JVM, you might worry about how to configure it to best match the requirements of your program. Fortunately, for a lot of use cases, you won’t need to do any manual tuning. The HotSpot JVM contains a process called ergonomics that examines the execution environment at startup and chooses some sensible defaults for the GC strategy, heap size, and JIT compilers based on the number of CPU cores and amount of RAM available. The current defaults are
◉ Garbage collector: G1GC
◉ Initial heap: 1/64th of physical memory
◉ Maximum heap: 1/4th of physical memory
◉ JIT compiler: Tiered compilation using both C1 and C2
You can see all of the ergonomic defaults the HotSpot JVM will choose for your environment by using the option -XX:+PrintFlagsFinal and using the grep command to search for ergonomic, as follows:
Copy code snippet
Copied to ClipboardError: Could not CopyCopied to Clipboard
java -XX:+PrintFlagsFinal | grep ergonomic
intx CICompilerCount = 4 {product} {ergonomic}
uint ConcGCThreads = 2 {product} {ergonomic}
uint G1ConcRefinementThreads = 8 {product} {ergonomic}
size_t G1HeapRegionSize = 2097152 {product} {ergonomic}
uintx GCDrainStackTargetSize = 64 {product} {ergonomic}
size_t InitialHeapSize = 526385152 {product} {ergonomic}
size_t MarkStackSize = 4194304 {product} {ergonomic}
size_t MaxHeapSize = 8403288064 {product} {ergonomic}
size_t MaxNewSize = 5041553408 {product} {ergonomic}
size_t MinHeapDeltaBytes = 2097152 {product} {ergonomic}
uintx NonNMethodCodeHeapSize = 5836300 {pd product} {ergonomic}
uintx NonProfiledCodeHeapSize = 122910970 {pd product} {ergonomic}
uintx ProfiledCodeHeapSize = 122910970 {pd product} {ergonomic}
uintx ReservedCodeCacheSize = 251658240 {pd product} {ergonomic}
bool SegmentedCodeCache = true {product} {ergonomic}
bool UseCompressedClassPointers = true {lp64_product} {ergonomic}
bool UseCompressedOops = true {lp64_product} {ergonomic}
bool UseG1GC = true {product} {ergonomic}
This output above is from JDK 11 on a machine with 32 GB of RAM, so the initial heap is set to 1/64th of 32 GB (approximately 512 MB) and the maximum heap is 1/4th of 32 GB (8 GB).
Taking control
If you think the default settings chosen by the ergonomics process will not be a good match for your application, you’ll be pleased to know the HotSpot JVM is highly configurable in every area.
There are three main types of options.
◉ Standard: Basic startup options such as -classpath that are common across HotSpot JVM implementations.
◉ -X: Nonstandard options used to configure common properties of the HotSpot JVM such as controlling the maximum heap size (-Xmx); these are not guaranteed to be supported on all HotSpot JVM implementations.
◉ -XX: Advanced options used to configure advanced properties of the HotSpot JVM. According to the documentation, these are subject to change without notice, but the Java team has a well-managed process for removing them.
The -XX options
Many of the -XX options can be further characterized as follows:
Product. These are the most commonly used -XX options.
Experimental. These are options related to experimental features in the HotSpot JVM that may not yet be production-ready. These options allow you to try out new HotSpot JVM features, and they need to be unlocked by specifying the following:
-XX:+UnlockExperimentalVMOptions
For example, the ZGC garbage collector in JDK 11 can be accessed using
java -XX:+UnlockExperimentalVMOptions -XX:+UseZGC
Once an experimental feature becomes production-ready, the options that control it are no longer classed as experimental and do not require unlocking. The ZGC collector became a product option in JDK 15.
Manageable. These options can also be set at runtime via the MXBean API or other JDK tools. For example, to show locks held by java.util.concurrent classes in a HotSpot JVM thread dump use
java -XX:+PrintConcurrentLocks
Diagnostic. These options are related to accessing advanced diagnostic information about the HotSpot JVM. These options require you to use the following before they can be used:
-XX:+UnlockDiagnosticVMOptions
An example diagnostic option is
-XX:+LogCompilation
It instructs the HotSpot JVM to output a log file containing details of all the optimizations made by the JIT compilers. You can inspect this output to understand which parts of your program were optimized and to identify parts of your program that might not have been optimized as you expected.
The LogCompilation output is verbose but can be visualized in a tool such as JITWatch, which can tell you about method inlining, escape analysis, lock elision, and other optimizations that the HotSpot JVM made to your running code.
Developmental. These options allow configuration and debugging of the most-advanced HotSpot JVM settings, and they require a special debug HotSpot JVM build before you can access them.
Added and removed options
The addition and removal of option switches follows the arrival or deprecation of major features in the HotSpot JVM. Here are some notable points.
◉ In JDK 9 many of the -XX:+Print... and -XX:+Trace... logging options were removed and replaced by the -Xlog option for controlling the unified logging subsystem introduced by JEP 158.
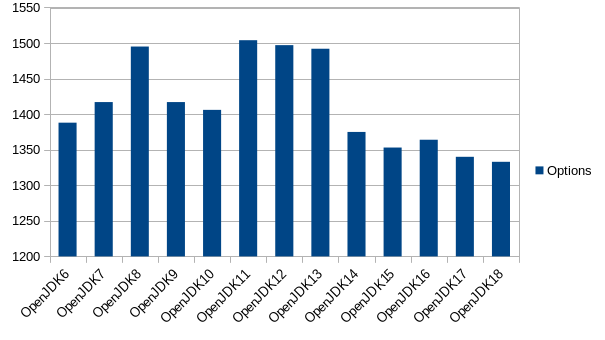
◉ The option count peaked in JDK 11 at a whopping 1,504 after the addition of options for the experimental ZGC, Epsilon, and Shenandoah garbage collectors.
◉ There was a large drop in JDK 14 with the removal of the Concurrent Mark Sweep (CMS) garbage collector, as discussed in JEP 363.
Figure 4 shows the number of HotSpot JVM options in each version of OpenJDK.
Figure 4. Total number of options (including product, experimental, diagnostic, and developmental) in each version of OpenJDK
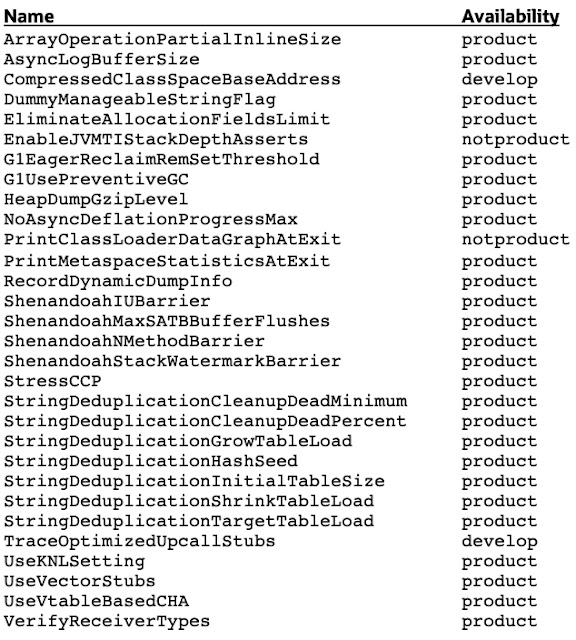
Table 1 shows the HotSpot JVM options that were in OpenJDK 16 that were removed from OpenJDK 17. Table 2 shows the new HotSpot JVM options added to OpenJDK 17.
Table 1. The HotSpot JVM options in OpenJDK 16 that were removed from OpenJDK 17
Table 2. The new HotSpot JVM options added to OpenJDK 17
So long and farewell!
So how does the HotSpot JVM development team manage the removal of options? Since JDK 9, the process for removing -XX options was extended to a three-step process of deprecate, obsolete, and expire to give users plenty of warning that their Java command line may soon need to be updated.
Let’s look at how the HotSpot JVM responds to the -XX:+AggressiveOpts option, which was deprecated in JDK 11, obsoleted in JDK 12, and finally expired in JDK 13.
Deprecated options. These options are supported, but a warning is printed to let you know that support may be removed in the future, for example
./jdk11/bin/java -XX:+AggressiveOpts
OpenJDK 64-Bit Server VM warning: Option AggressiveOpts was deprecated in version 11.0 and will likely be removed in a future release.
Obsolete options. These options have been removed but they are still accepted on the command line. A warning is printed to let you know that these options might not be accepted in the future, for example
./jdk12/bin/java -XX:+AggressiveOpts
OpenJDK 64-Bit Server VM warning: Ignoring option AggressiveOpts; support was removed in 12.0
Expired options. These are deprecated or obsolete options that have an accept_until version less than or equal to the current JDK version. A warning is printed when these options are used in the JDK version in which they expired, for example
./jdk13/bin/java -XX:+AggressiveOpts
OpenJDK 64-Bit Server VM warning: Ignoring option AggressiveOpts; support was removed in 12.0
Total failure. Once you go past the JDK version in which an option was expired, the HotSpot JVM will fail to start when the option is passed and a warning is printed, for example
./jdk14/bin/java -XX:+AggressiveOpts
Unrecognized VM option 'AggressiveOpts'
Error: Could not create the Java Virtual Machine.
Error: A fatal exception has occurred. Program will exit.
Sadly, not every option is retired in this orderly manner.
For example, JDK 9 dropped support for a large number of options when it introduced unified logging and the powerful -Xlog option, which is covered in detail in Nicolai Parlog’s blog. There is also a page on the Java documentation website for converting deprecated logging options to Xlog.
Migrating to a later JDK
So, how can you prepare for migrating your Java command line to a later JDK? Perhaps you’ve inherited a command line full of options you’ve never heard of and you are afraid to touch them for fear of destabilizing your application.
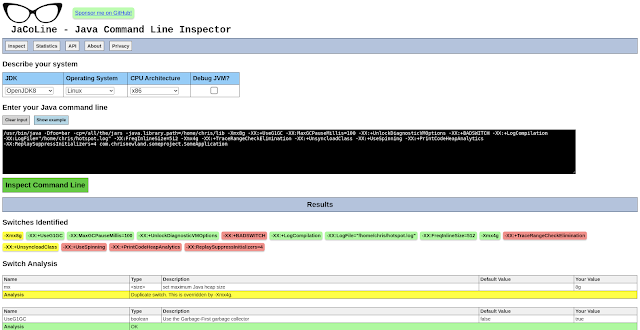
I have created a tool to help you: JaCoLine, the Java Command Line Inspector. You can paste in your command line, choose your target platform, and get an analysis of how your options will work. See Figure 5.
Figure 5. Analyzing command-line options with JaCoLine
These are a few of my favorite things!
Admit it: You came here seeking the magic turbo button that will supercharge your applications. Well, while there is no one-size-fits-all advice when it comes to HotSpot JVM tuning, there are certainly options I believe will help you better understand the execution of your program and make sensible configuration choices.
The following options are available in JDK 11 and later. I’m choosing these switches because many developers have not moved to later versions of Java. And remember, these are all optional; the HotSpot JVM’s defaults are very good.
First, understand memory usage. Allocating memory in the HotSpot JVM is cheap. Garbage collection cost is the tax that falls due sometime later in the form of execution pauses while the HotSpot JVM cleans up the no-longer-needed objects in the heap.
Understanding the heap allocations made by your code and the resulting GC behavior could be the lowest hanging fruit when it comes to improving application performance and stability, because a mismatch between the heap and GC configuration and your application’s allocation behavior can lead to excessive pauses that interrupt the progress of your application.
The JaCoLine Statistics web page confirms that configuring the heap and GC logging are the most popular options across all the command lines JaCoLine examined.
To configure the heap, consider the answers to the following questions:
◉ What is the maximum expected heap usage under normal conditions?
◉ -Xmx sets the maximum heap size, for example, -Xmx8g.
◉ -XX:MaxRAMPercentage=n sets the maximum heap as a percentage of total RAM.
◉ How quickly do you expect the heap to reach its maximum size?
◉ -Xms sets the initial heap size, for example, -Xms256m.
◉ -XX:InitialRAMPercentage=n sets the maximum heap as a percentage of total RAM.
◉ If you expect the heap to grow rapidly, you can set the initial heap closer to the maximum heap value.
To deal with OutOfMemory errors, consider how the HotSpot JVM should behave if your application runs out of memory.
◉ -XX:+ExitOnOutOfMemoryError tells the HotSpot JVM to exit on the first OutOfMemory error. This can be useful if the HotSpot JVM will be automatically restarted.
◉ -XX:+HeapDumpOnOutOfMemoryError will help you diagnose memory leaks by dumping the contents of the heap to a file (java_pid.hprof in the working directory).
◉ -XX:HeapDumpPath defines the path for the heap dump.
Second, choose a garbage collector. The G1GC collector will be selected by default by the JDK 11 ergonomics process on most hardware, but it is not the only choice in JDK 11 and later.
Other garbage collectors available are
◉ -XX:+UseSerialGC selects the serial collector, which performs all GC work on a single thread.
◉ -XX:+UseParallelGC selects the parallel (throughput) collector, which can perform compaction using multiple threads.
◉ -XX:+UseConcMarkSweepGC selects the CMS collector. Note that the CMS collector was deprecated in JDK 9 and was removed in JDK 14.
◉ -XX:+UnlockExperimentalVMOptions -XX:+UseZGC selects the ZGC collector (experimental in JDK 11 and a standard feature in JDK 14 and later; thus you won’t need this switch).
Advice on selecting a collector for your application can be found in the HotSpot Virtual Machine Garbage Collection Tuning Guide. That’s the version of the document for JDK 11; if you are on a later version of Java, search for the updated documentation.
To avoid premature promotion, consider whether your application creates short-lived objects at a high allocation rate. That can lead to the premature promotion of short-lived objects to the old-generation heap space, where they will accumulate until a full garbage collection is needed.
◉ -XX:NewSize=n defines the initial size for the young generation.
◉ -XX:MaxNewSize=n defines the maximum size for the young generation.
◉ -XX:MaxTenuringThreshold=n is the maximum number of young-generation collections an object can survive before it is promoted to the old generation.
To log memory usage and GC activity, do the following:
◉ Get a full breakdown of the HotSpot JVM’s memory usage upon exit by using
-XX:+UnlockDiagnosticVMOptions ‑XX:NativeMemoryTracking=summary ‑XX:+PrintNMTStatistics.
◉ Enable GC logging with the following:
◉ -Xlog:gc provides basic GC logging.
◉ -Xlog:gc* provides verbose GC logging.
Finally, understand how the JIT compilers optimized your code. Once you are happy that your application’s GC pauses are at an acceptable level, you can check that the HotSpot JVM’s JIT compilers are optimizing the parts of your program you think are important for performance.
Enable simple compilation logging, as follows:
◉ -XX:+PrintCompilation prints basic information about each JIT compilation to the console.
◉ -XX:+UnlockDiagnosticVMOptions ‑XX:+PrintCompilation ‑XX:+PrintInlining adds information about method inlining.
Example output:
java -XX:+PrintCompilation
77 1 3 java.lang.StringLatin1::hashCode (42 bytes)
78 2 3 java.util.concurrent.ConcurrentHashMap::tabAt (22 bytes)
78 3 3 jdk.internal.misc.Unsafe::getObjectAcquire (7 bytes)
80 4 3 java.lang.Object:: (1 bytes)
80 5 3 java.lang.String::isLatin1 (19 bytes)
80 6 3 java.lang.String::hashCode (49 bytes)
The items in the output are (from left to right) as follows:
Source: oracle.com


0 comments:
Post a Comment