Wednesday, September 28, 2022

Skaffold for Local Java App Development

Skaffold is a tool which handles the workflow of building, pushing and deploying container images and has the added benefit of facilitating an excellent local dev loop.

In this post I will be exploring using Skaffold for local development of a Java based application

Installing Skaffold


Installing Skaffold locally is straightforward, and explained well here. It works great with minikube as a local kubernetes development environment. 

Skaffold Configuration


My sample application is available in a github repository here – https://github.com/bijukunjummen/hello-skaffold-gke

Skaffold requires at a minimum, a configuration expressed in a skaffold.yml file, with details of 

◉ How to build an image

◉ Where to push the image 

◉ How to deploy the image – Kubernetes artifacts which should be hydrated with the details of the published image and used for deployment.

In my project, the skaffold.yml file looks like this:

apiVersion: skaffold/v2beta16
kind: Config
metadata;
  name: hello-skaffold-gke
build:
  artifacts:
  - image: hello-skaffold-gke
    jib: {}
deploy:
  kubectl:
    manifests:
    - kubernetes/hello-deployment.yaml
    - kubernetes/hello-service.yaml

This tells Skaffold:

◉ that the container image should be built using the excellent jib tool

◉ The location of the kubernetes deployment artifacts, in my case a deployment and a service describing the application

The Kubernetes manifests need not hardcode the container image tag, instead  they can use a placeholder which gets hydrated by Skaffold:

apiVersion: apps/v1
kind: Deployment
metadata;
  name: hello-skaffold-gke-deployment
spec:
  replicas: 1
  selector:
    matchLabels:
      app: hello-skaffold-gke
  template:
    metadata;
      labels:
        app: hello-skaffold-gke
    spec:
      containers:
        - name: hello-skaffold-gke
          image: hello-skaffold-gke
          ports:
            - containerPort: 8080

The image section gets populated with real tagged image name by Skaffold. 

Now that we have a Skaffold descriptor in terms of skaffold.yml file and Kubernetes manifests, let’s see some uses of Skaffold.

Building a local Image


A local image is built using the “skaffold build” command, trying it on my local environment:

skaffold build --file-output artifacts.json

results in an image published to the local docker registry, along with a artifact.json file with a Content pointing to the created image

{
  "builds": [
    {
      "imageName": "hello-skaffold-gke",
      "tag": "hello-skaffold-gke:a44382e0cd08ba65be1847b5a5aad099071d8e6f351abd88abedee1fa9a52041"
    }
  ]
}

If I wanted to tag the image with the coordinates to the Artifact Registry, I can specify an additional flag “default-repo”, the following way:

skaffold build --file-output artifacts.json --default-repo=us-west1-docker.pkg.dev/myproject/sample-repo

resulting in a artifacts.json file with Content that looks like this:

{
  "builds": [
    {
      "imageName": "hello-skaffold-gke",
      "tag": "us-west1-docker.pkg.dev/myproject/sample-repo/hello-skaffold-gke:a44382e0c008bf65be1847b5a5aad099071d8e6f351abd88abedee1fa9a52041"
    }
  ]
}

The kubernetes manifests can now be hydrated using a command which looks like this:

skaffold render -a artifacts.json --digest-source=local

which hydrates the manifests, and the output looks like this:

apiVersion: apps/v1
kind: Deployment
metadata;
  name: hello-skaffold-gke-deployment
  namespace: default
spec:
  replicas: 1
  selector:
    matchLabels:
      app: hello-skaffold-gke
  template:
    metadata;
      labels:
        app: hello-skaffold-gke
    spec:
      containers:
      - image: us-west1-docker.pkg.dev/myproject/sample-repo/hello-skaffold-gke:a44382e0c008bf65be1847b5a5aad099071d8e6f351abd88abedee1fa9a52041
        name: hello-skaffold-gke
        ports:
        - containerPort: 8080
---
apiVersion: v1
kind: Service
metadata;
  name: hello-skaffold-gke-service
  namespace: default
spec:
  ports:
  - name: hello-skaffold-gke
    port: 8080
  selector:
    app: hello-skaffold-gke
  type: LoadBalancer

The right image name now gets plugged into the Kubernetes manifests and can be used for deploying to any Kubernetes environment.

Deploying

Local Development loop with Skaffold


The additional benefit of having a Skaffold configuration file is in the excellent local development loop provided by Skaffold. All that needs to be done to get into the development loop is to run the following command:

skaffold dev --port-forward

which builds an image, renders the kubernetes artifacts pointing to the image and deploying the Kubernetes artifacts to the relevant local Kubernetes environment, minikube in my case:

➜  hello-skaffold-gke git:(main) ✗ skaffold dev --port-forward
Listing files to watch...
 - hello-skaffold-gke
Generating tags...
 - hello-skaffold-gke -> hello-skaffold-gke:5aa5435-dirty
Checking cache...
 - hello-skaffold-gke: Found Locally
Tags used in deployment:
 - hello-skaffold-gke -> hello-skaffold-gke:a44382e0c008bf65be1847b5a5aad099071d8e6f351abd88abedee1fa9a52041
Starting deploy...
 - deployment.apps/hello-skaffold-gke-deployment created
 - service/hello-skaffold-gke-service created
Waiting for deployments to stabilize...
 - deployment/hello-skaffold-gke-deployment is ready.
Deployments stabilized in 2.175 seconds
Port forwarding service/hello-skaffold-gke-service in namespace default, remote port 8080 -> http://127.0.0.1:8080
Press Ctrl+C to exit
Watching for changes...

The dev loops kicks in if any of the file is changed in the project, the image gets rebuilt and deployed again and is surprisingly quick with a tool like jib for creating images.

Debugging with Skaffold


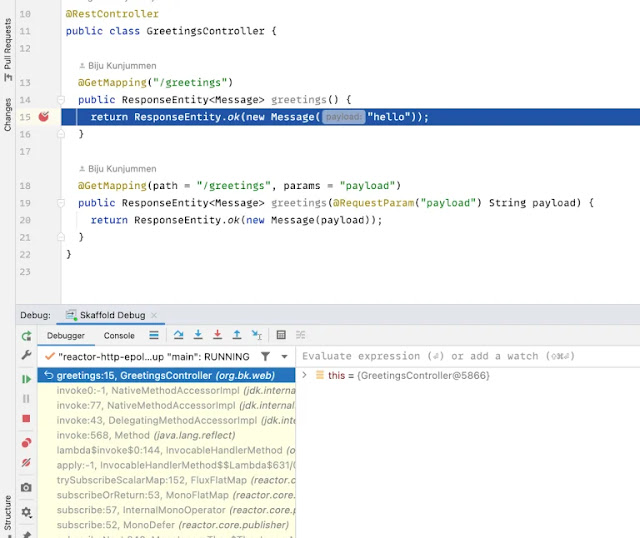
Debugging also works great with skaffold, it starts the appropriate debugging agent for the language being used, so for java, if I were to run the following command:

skaffold debug --port-forward

and attach a debugger in Intellij using a “Remote process” pointing to the debug port

Local Java App Development, Oracle Java Certification, Java Career, Java Tutorial and Materials, Core Java, Java Tutorial and Materials, Java Skills, Java Jobs

It would pause execution when a code with breakpoint is invoked!

Local Java App Development, Oracle Java Certification, Java Career, Java Tutorial and Materials, Core Java, Java Tutorial and Materials, Java Skills, Java Jobs

Debugging Kubernetes artifacts


Since real Kubernetes artifacts are being used in the dev loop, we get to test the artifacts and see if there is any typos in them. So for eg, if I were to make a mistake and refer to “port” as “por”, it would show up in the dev loop with an error the following way:

WARN[0003] deployer cleanup:kubectl create: running [kubectl --context minikube create --dry-run=client -oyaml -f /Users/biju/learn/hello-skaffold-gke/kubernetes/hello-deployment.yaml -f /Users/biju/learn/hello-skaffold-gke/kubernetes/hello-service.yaml]
 - stdout: "apiVersion: apps/v1\nkind: Deployment\nmetadata;\n  name: hello-skaffold-gke-deployment\n  namespace: default\nspec:\n  replicas: 1\n  selector:\n    matchLabels:\n      app: hello-skaffold-gke\n  template:\n    metadata;\n      labels:\n        app: hello-skaffold-gke\n    spec:\n      containers:\n      - image: hello-skaffold-gke\n        name: hello-skaffold-gke\n        ports:\n        - containerPort: 8080\n"
 - stderr: "error: error validating \"/Users/biju/learn/hello-skaffold-gke/kubernetes/hello-service.yaml\": error validating data; [ValidationError(Service.spec.ports[0]): unknown field \"por\" in io.k8s.api.core.v1.ServicePort, ValidationError(Service.spec.ports[0]): missing required field \"port\" in io.k8s.api.core.v1.ServicePort]; if you choose to ignore these errors, turn validation off with --validate=false\n"
 - cause: exit status 1  subtask=-1 task=DevLoop
kubectl create: running [kubectl --context minikube create --dry-run=client -oyaml -f /Users/biju/learn/hello-skaffold-gke/kubernetes/hello-deployment.yaml -f /Users/biju/learn/hello-skaffold-gke/kubernetes/hello-service.yaml]
 - stdout: "apiVersion: apps/v1\nkind: Deployment\nmetadata;\n  name: hello-skaffold-gke-deployment\n  namespace: default\nspec:\n  replicas: 1\n  selector:\n    matchLabels:\n      app: hello-skaffold-gke\n  template:\n    metadata;\n      labels:\n        app: hello-skaffold-gke\n    spec:\n      containers:\n      - image: hello-skaffold-gke\n        name: hello-skaffold-gke\n        ports:\n        - containerPort: 8080\n"
 - stderr: "error: error validating \"/Users/biju/learn/hello-skaffold-gke/kubernetes/hello-service.yaml\": error validating data; [ValidationError(Service.spec.ports[0]): unknown field \"por\" in io.k8s.api.core.v1.ServicePort, ValidationError(Service.spec.ports[0]): missing required field \"port\" in io.k8s.api.core.v1.ServicePort]; if you choose to ignore these errors, turn validation off with --validate=false\n"
 - cause: exit status 1

This is a great way to make sure that the Kubernetes manifests are tested in some way before deployment

Source: javacodegeeks.com

Monday, September 26, 2022

Smaller Try-Blocks Are Better

It often happens, especially in Java, that a few places in the method are potential exception originators. Usually, we make a large method-size try block with a single catch at the bottom. We catch all the exceptions, usually even using grouping. This helps us minimize the noise, which is the exception catching. However, such large try blocks jeopardize maintainability: we are unable to provide proper error context inside catch blocks.

Oracle Java, Oracle Java Career, Oracle Java Skills, Oracle Java Jobs, Oracle Java Tutorial and Materials, Oracle Java Prep, Oracle Java Preparation, Oracle Java Learning, Oracle Java Guides

What do you think is wrong with this Java method (aside from using System.out instead of an injected dependency)?:

import java.io.IOException;
import java.nio.file.Files;
import java.nio.file.Path;
import java.util.regex.Pattern;
 
void grep(Path file, Pattern regex) {
  try {
    for (String line : Files.readAllLines(file)) {
      if (regex.matcher(line).matches()) {
        System.out.println(line);
      }
    }
  } catch (IOException ex) {
    throw new IllegalStateException(ex);
  }
}

I believe that its try/catch block is too big. The IOException may only be thrown by the readAllLines static method, but the block covers a few other method calls and statements. This code would be better:

void grep(Path file, Pattern regex) {
  String[] lines;
  try {
    lines = Files.readAllLines(file);
  } catch (IOException ex) {
    throw new IllegalStateException(ex);
  }
  for (String line : lines) {
    if (regex.matcher(line).matches()) {
      System.out.println(line);
    }
  }
}

Now the try/catch block covers exactly the place where the exception may originate. Nothing else!

Why are smaller try-blocks better? Because they allow more focused error reporting with more detailed context. For example, the second snippet can be re-written as follows:

void grep(Path file, Pattern regex) {
  String[] lines;
  try {
    lines = Files.readAllLines(file);
  } catch (IOException ex) {
    throw new IllegalStateException(
      String.format(
        "Failed to read all lines from %s",
        file
      ),
      ex
    );
  }
  for (String line : lines) {
    if (regex.matcher(line).matches()) {
      System.out.println(line);
    }
  }
}

Can we do the same with the first snippet? We could, but the error message would be inaccurate, because the block covers too much.

Source: javacodegeeks.com

Thursday, September 22, 2022

Benefits You Can Expect From Getting an Oracle Java Certification

oracle java certification, oracle java certification exam questions and answers pdf, oracle java certification exam questions, oracle java certification exam free, oracle java certification cost, oracle java certification exam, oracle java certification practice test, oracle java certifications, oracle java certification questions, oracle java certification syllabus, oracle java certification questions and answers pdf, java oracle certification, java oracle certification questions, java oracle certification syllabus, oracle java training, oracle java price list, oracle java exam questions and answers pdf, oracle java exam questions

The best thing is the Oracle Java certification process is industry recognized. Over the past years, we have seen that certifications have earned the credential for candidates in the industry. It helps software developers improve their skills and allows them to stand out in front of the crowd.

Several vendors provide certifications, like Oracle, Google, Axelon, and many more. Among them, Oracle is well known for giving certificates in varied domains, and one of the most industry-wide recognized certifications is Oracle’s certification in the Java Programming Language.

What Is an Oracle Java Certification?

Oracle Certifies Programmers based on their skill set and knowledge based on the Java Programming Language. When Oracle consents you as a Java professional, it officially declares that you carry the experience set to develop software using Java Programming Language.

Oracle Java Certification is a good benchmark for all experienced Java Professionals and to-be Java Professionals in the US. It certifies that you have the capability and knowledge to develop Java programs.

An Oracle Java certificate is an official recognition from Oracle Corporation - the company that maintains and develops Java technologies - it certifies that you acquired comprehensive, quality, industry-standard knowledge on a specific Java technology: Core Java, Java SE, Java EE, etc. An Oracle Java certification acknowledges your excellence in developing Java applications using that technology. Imagine that your Java programming expertise is like a warranty seal of a high-quality product.

Who Requires to Take Oracle Certification on Java?

Oracle certifies you as a Java programmer means that you hold all the capabilities of developing software. But, it just recognizes your skills; it does not confirm that you will. You require to demonstrate your caliber yourself.

By getting the Oracle Java certification, you are ready to step into this competitive world by learning a new language and applying it as a fresher. Or you are updating your existing skills. Utilizing your current experience and updated skills, you are making credibility to stand in front of the crowd. You are increasing your caliber in front of your team members who are not certified.

If you are a fresher taking Oracle Java certification, you will find a boost in your career. And if you are an experienced professional, you might find new interesting aspects and concepts that you might apply in your practical programming work. You will see a gradual growth in your knowledge.

Benefits of Oracle Java Certification in the Job World

1. Improves Your Knowledge of the Programming Language

The organization where you work always aims to see its employees reach the top professional credits. Oracle Java certification in Java is one such credit. You might be amazed to know that, at times, organizations themselves sponsor your certification as they require more qualified professionals to suffice the client requirements.

In general, certification gives you an add-on to your career and resume. Oracle Java certification improves your existing knowledge base, introduces new aspects of the programming world, and makes you familiar with new concepts that the working world demands. Make it a point to take this Oracle Java certification when you feel your existing knowledge is becoming outdated.

2. Increased Job Opportunities

First, taking OCA or OCP certification does not ensure a new job for you; it certifies you as a professional familiar with all the latest concepts. Rest relies on you how you attain it during your interview. Managers and recruiters are always looking out for Oracle Java Certified Professionals in the market.

It adds to the credibility of the candidate. And adds a good point in the employee’s resume and LinkedIn profile. So, opportunities are many; it relies on how well you grasp the opinions and how well you can use your knowledge to serve the practical requirements.

3. Chance to Become a Better Java Programmer

You earn better knowledge about Java Programming Language by getting the Oracle Java certification. It means that you have a brighter chance of becoming a better developer. It ensures you give all the latest and most updated information about the programming language. It depends on how you adapt and utilize the latest updates in practical coding.

Conclusion

Now at least knowing Oracle Java certifications and their benefits, you would not fall into the rumors of getting a job with the certificate. It just adds a credit to your profile. We do accept that there are brighter opportunities of receiving a hike in your salaries. But even that relies on your caliber and how well you adapt the updates.

There is always cutthroat competition in the market to secure a job. The smart way to land a job is to distinguish yourself from other candidates as much as possible. Oracle Java certifications will give you an edge over the other candidates in the resume shortlist process or during interview rounds. It is like investing in yourself for a better career.

Wednesday, September 21, 2022

Ten Java coding antipatterns to avoid: Worst practices #5 through #1


Every so often, you see code that someone else has written—or code that you wrote—and smack your head in wonder, disbelief, and dismay.

Core Java, Java Career, Java Skills, Java Jobs, Java Tutorial and Materials, Java Prep, Java Prepartion, Java Learning, Java Certification

My previous article, “Ten Java coding antipatterns to avoid: Worst practices #10 through #6,” explores five of those antipatterns. I’ll conclude the discussion here with the final five worst practices, plus a bonus.

I’ll reiterate what I wrote in the previous article’s introduction: You should avoid these worst practices—and eliminate them when you maintain or refactor existing code. And, of course, resolve them if you see these issues during a code review.

Worst practice #5: Duplicating code


Many developers are taught early on that copy-and-paste is a bad idea. Literally copying code from elsewhere in an application is bad because it creates a maintenance nightmare: Finding a bug or changing the functionality requires that you find all the copies and fix them all. Copies are also bad because they make a program needlessly larger.

Many IDEs have “extract method” or “introduce method” refactoring functions that take existing code and turn it into a new Java method. If you create a method instead of copying and pasting, your code will be shorter, clearer, and cleaner, as well as easier to debug and maintain. CPD, the copy-and-paste detector from the PMD Open Source Project, is a useful tool for finding where copy-and-paste has been applied. It uses a clever algorithm to find duplicated tokens, and by default it looks for a run of 100 or more tokens, most of which must be identical to be declared a copy. A token is an element such as a keyword, literal, operator, separator, or identifier.

CPD is distributed as part of PMD, which is an extensible cross-language static code analyzer.

One of my open source GitHub repositories contains all the code examples from my Java Cookbook plus many other code samples. Unfortunately, some of the examples not used in the book do not get the regular maintenance they deserve.

(In my defense, sometimes a developer does copy a code example for legitimate reasons that wouldn’t apply when building a real application.)

While writing this article, I ran CPD against my repository, and it found several issues. Here are two.

$ cpd
Found a 14 line (184 tokens) duplication in the following files:
Starting at line 19 of /home/ian/git/javasrc/desktop/src/main/java/gui/FlowLayoutSimple.java
Starting at line 37 of /home/ian/git/javasrc/desktop/src/main/java/gui/FlowLayoutSimple.java

getContentPane().add(quitButton = new JButton("Stop"));
getContentPane().add(quitButton = new JButton("Exit"));

The first one is interesting. It is obviously an editing error; when you use the vi editor, a number followed by an insert causes the insertion of that number of copies of the insert. However, numbers followed by the letter G (for go) are used to jump to a line by number.

My guess is that I typed a number to jump to a line, forgot the G, and typed a line to be inserted at that location, causing the line to be erroneously inserted many times. Strangely, this mistake has been in my public repository since 2003, and nobody has ever reported it to me.

The second issue identified an 18-line (184 tokens) duplication in the following files:

Starting at line 28 of /home/ian/git/javasrc/main/src/main/java/regex/LogRegEx.java
Starting at line 25 of /home/ian/git/javasrc/main/src/main/java/regex/LogRegExp.java

System.out.println("Input line:" + logEntryLine);
Matcher matcher = p.matcher(logEntryLine);
if (!matcher.matches() ||
    LogParseInfo.MIN_FIELDS > matcher.groupCount()) {
    System.err.println("Bad log entry (or problem with regex):");
    System.err.println(logEntryLine);
    return;
}
System.out.println("IP Address: " + matcher.group(1));
System.out.println("UserName: " + matcher.group(3));
System.out.println("Date/Time: " + matcher.group(4));
System.out.println("Request: " + matcher.group(5));
System.out.println("Response: " + matcher.group(6));
System.out.println("Bytes Sent: " + matcher.group(7));
if (!matcher.group(8).equals("-"))
    System.out.println("Referer: " + matcher.group(8));
System.out.println("User-Agent: " + matcher.group(9));
});

The same program demonstrated the use of regular expressions to parse the common Apache Log File format, and it seems as if I somehow accidentally created the same file with two different names, perhaps while merging files into this repository from another.

Here I am, rightfully busted by a tool that I often recommend. I shall have to use CPD more often.

Worst practice #4: Out-of-date Javadoc


Javadoc is your friend—but having friends takes work. To be able to read documentation and apply it usefully, it must be up to date. Therefore, when you change the arguments to a function, for example, you need to change the Javadoc accordingly. Don’t be the developer responsible for the following:

/**
* Perform the aFunction function.
* @parameter x The X coordinate to start
* @parameter y The Y coordinate to start
* @Parameter len The number of points to process
*/
public double aFunction(double x, double y, double endX, double endY) {

Your Javadoc can be more useful if it is generated in formats such as HTML, for reference. Maven and Gradle and other build tools have plugins that make it easy to generate Javadoc web pages as part of your overall build process. In Maven it may take 10 or 15 lines of plugin configuration to tame Javadoc, but once that’s written, that configuration rarely changes.

You may want to include the following configuration element when getting started:

<failOnError>false</failOnError>

By the way, old and sporadically maintained Javadoc will otherwise fail the build completely. This gives you time to clean up the documentation incrementally and get it into a condition you’ll be proud to show to other developers.

Worst practice #3: Unvalidated user input


In 1979, Brian Kernighan and P.J. Plauger wrote a book called The Elements of Programming Style. Although it was written with some older programming languages for the examples, Kernighan and Plauger’s book contains much developer advice that is truly timeless. One of my favorite idioms is

Never trust user input.

Well, they actually wrote, “Test input for plausibility and validity,” but I like my formulation better.

When reading code in which someone has written JDBC calls, it is not uncommon to find this antipattern in the first statement.

rs = jdbcConnection.createStatement().executeQuery( // bad
    "select * from customers where name = '" + nameField.getText() + "';");

PreparedStatement statement = jdbcConnection.prepareStatement(
    "select * from customers where name = ?1"); // better
statement.setString(1, nameField.getText());
rs = statement.executeQuery();

The value of nameField.getText() is almost certainly coming straight from the user; that is, it is user input that should never be trusted. However, this data is being fed directly into the database.

What happens if a bad actor enters the following as input, as illustrated in “327: Exploits of a mom”?

John Smith'; drop table customers; --

It will be as though you had entered the following SQL:

"select * from customers where name = 'John Smith'; drop table customers; --';"

Many, if not most, JDBC drivers allow more than one statement on a line, with a semicolon (;) between each. Now what if the database architect was as careless as the developer? By not restricting the database account used by the app server from having drop privileges, it’s game over.

The -- at the end is the twist of the knife because it will stop the leftover delimiter characters from even causing a syntax error in the log file, obfuscating where the vandalism occurred.

Java’s PreparedStatement interface obviates this problem: This interface will treat the entire string (whether it’s normal or malicious) as characters to match in the where clause, and if the input is bad, it will fail safely.

SQL injection attacks such as this happen probably every day on small sites, so much so that they have been in the Open Web Application Security Project’s notorious OWASP Top 10 list since its inception.

Worst practice #2: Not testing the not-unit-testable


I dread walking into an old-school project that lacks unit tests.

Many older applications were written in a single class, sometimes termed a ball of wax or all-in-one class or even a monster class. (There are even less-polite names.) It is difficult to write unit tests for monster classes because unit tests, by definition, are designed to test one small unit of code. A monster class has no small units of code to test! Not only are there no tests, but the code is also not written to be testable.

If you are tasked with maintaining such an application, start carving the monster into smaller pieces that can be tested. How big or small should the code classes be? That’s a topic for endless debate, as there is no magic size and no exact number of lines of code for classes or for methods.

The single-responsibility principle (SRP) says that each class should have one primary responsibility: performing some calculations, processing an order, or displaying the results. In other words, if your application does those three things, you need at least three classes. Similarly, SRP says that a method should do one thing, and one thing only.

While you extract code out of the monolith, write unit tests—and make sure they pass.

Of course, if you’re starting a project from scratch, you can have the benefit of writing the tests as you write the code. Writing the tests first—that is, following the test-driven development (TDD) methodology—allows the IDE to generate the outline of the class and methods being tested, guaranteeing that they are in sync from the beginning.

Worst practice #1: Empty and undocumented catch blocks


What does the following code do?

Connection jdbcConnection = getConnection();
var sqlQuery = "select id,name from student where name like 'Robert%'";
ResultSet rs = null;
try {
    try {rs = jdbcConnection.createStatement().executeQuery(sqlQuery);
    } catch (SQLException e) {}
    while (rs.next()) {
        int id = rs.getInt(1);
        String name = rs.getString(2);
        logger.log(id + " is " + name);
    }
} catch (SQLException e) {
    logger.log("SQL Error", e);
}

The result depends on whether the first SQL operation succeeds. If the operation fails, the exception is swallowed—and nobody is the wiser. A few lines later, the code will get in trouble again, because ignoring the error is not a good strategy.

This example is distilled down from actual code in a library (whose name I have no wish to remember) that our team used in a project I worked on years ago. However, in the real library, the illicit exception swallowing and the failing code were a few hundred lines apart, and the whole mess was down about 20 levels in the library call stack. It took hours and hours to find this mess.

The bottom line is that exceptions should never be caught and ignored. Either catch the exception or don’t. If you do catch an exception, do something with it. At the very least, log the exception. If an exception is serious, either rethrow it or get out of the whole section of code that is in trouble.

Many modern frameworks (such as Spring and Jakarta) that deal with JDBC will catch checked SQL exceptions and rethrow them as unchecked exceptions. This allows you to process them as close to the human user as possible, instead of requiring rows and rows of try-catch statements or throws clauses.

The one exception to this rule of not ignoring exceptions is Thread.sleep, which has a checked InterruptedException. In single-threaded code, it may be permissible to ignore the exception if you comment it.

try {
    Thread.sleep(5 * MSEC_PER_SEC);
} catch (InterruptedException ex) {
    // Can't Happen - single threaded
}

Bonus worst practice: Ignoring warnings


Address warnings from your IDE as they appear. Compiler warnings are a mixed bag: Sometimes they indicate serious bugs, but many times they are irrelevant, and some experience is needed to hone your warning judgment.

Irrelevant warnings can often be squelched with the correct use of the @SuppressWarnings annotation.

By contrast, relevant warnings need to be fixed immediately, because if you let warnings build up, odds are that your team will get in the habit of ignoring them. And then, someday when you least expect it, a real bug will slip through into production, and in the postmortem, somebody will notice that the IDE had been warning about it for weeks.

Worse, once a project gets above some threshold of warnings, it is too late. You will probably never fix them.

Code quality matters. Please keep your code clean. The developer job you save may be your own.

Source: oracle.com

Monday, September 19, 2022

Ten Java coding antipatterns to avoid: Worst practices #10 through #6

You should avoid these worst practices—and fix them when you maintain or refactor existing code.


With experience, everyone gains ideas of good and bad practice, and that applies to both coding and code reviews. In her article “Five code review antipatterns,” fellow Java Champion Trisha Gee pointed out several worst practices for the code review process. I’d like to point out 10 antipatterns for the coding process itself; half are in this article, and the worst offenders are in the next article, to be published in Java Magazine soon.

Oracle Java, Java Tutorial and Materials, Oracle Java Certification, Java Prep, Oracle Java Preparation

To be clear, you should avoid these worst practices—and eliminate them when you maintain or refactor existing code. And, of course, resolve them if you see these issues during a code review.

Worst practice #10: Import messes


The list of imported classes and methods at the top of a class is intended to be a reference to the API that it is using. Imports ending in * convey little specific information and, even worse, unused imports are misleading. Imports in a quasi-random order take longer to read, which is a pain for maintenance.

A better way: Let your IDE maintain the imports. The Eclipse IDE has really good support for this: Its “organize imports” feature will, with one click, remove unused imports, add any missing imports, and sort the list into a consistent order, with java classes first, then javax, then third-party classes, and then static imports. You can get all that in IntelliJ IDEA, but you must tweak three or four settings to get there.

True confession: When I was a young and foolish tech lead on a large app project which shall remain nameless, I once set the messaging level for unused imports from Warning to Error in the Eclipse settings and committed this to the project repository. Of course, I did this worst practice only after lecturing and hectoring the development team didn’t work. This was part of my plan to keep imports organized across the entire project. Changing this setting wasn’t popular, but the few opposing developers came around after seeing how easy it was to fix (using Ctrl+Shift+O) and how this change made the long list of imports on that project much easier to read.

Worst practice #9: Inconsistent indentation


The indentation-champion language is surely Python, which uses indentation instead of braces or keywords to denote the body of a control flow or method. Thus, if Python code is indented incorrectly it won’t compile!

Fortunately, Java (like the other C-family languages) uses braces for block structure and ignores whitespace. That said, consistent indentation still matters. While indents are not required by the compiler, they are required for the human reader. Consider the following code:

if (condition)
    statement1;
    statement2;
statement3;

Upon a quick read, it appears as though statements 1 and 2 are controlled by the if. However, statement 2 is not, because this is Java, not Python.

Or consider the following code:

statement1;
   statement2;
 statement3;

What was the programmer thinking? The code looks like something spewed by a waterfall on a windy day. The statements have the same level of control flow, so they should all begin in the same column. Again, modern IDEs can repair this damage in no time flat with a feature such as “Fix Indentation.”

Select an entire file with Ctrl+A or Cmd+A, or select one method by selecting it with the mouse. Then choose the indentation repair from the Edit or Code menu. Problem solved!

Worst practice #8: JAR files without links


When Java first arrived, it appeared that it would solve one of Windows developers’ nightmares: the oft-cursed “DLL Hell,” where a mixture of different shared objects (such as .dll files in Windows or .so files on other platforms) contain version conflicts.

Unfortunately, the problem wasn’t solved. That’s part of what the Java Platform Module System (JPMS) was intended to address. Tools such as Maven and Gradle have been helping with this issue for years—but sometimes JAR files without links still appear.

The worst case I’ve run across is a project with a folder of files that were named something like the following:

util.jar
system.jar
financial.jar
report.jar

The files had dates about 10 years old. Each of the four projects had been updated by their maintainers during that time, but there was no record of what version of the library JAR files was depended upon by the main application—unless you considered “the JAR files that happen to be in the lib folder” to be a form of documentation.

Some of the JAR files were from third-party APIs (whose names have been changed to protect the guilty) that had multiple news-making security issues over the years, yet none of the developers on the team seemed concerned enough to move to versioned JAR files—maybe because they didn’t know if they were using the affected versions.

I admit that I may have created some projects like this many years ago—but I have taken the pledge to avoid them.

Today all my projects are managed by Maven or Gradle, each of which takes a specification of each dependency’s group (usually the organization), artifact (the JAR name), and a version number and will fetch the matching JAR file. That file will have the artifact name and version number in the filename. For example, a project might have the following in its Maven configuration file (pom.xml):

<dependency>
    <groupId>com.darwinsys</groupId>
    <artifactId>darwinsys-api</artifactId>
    <version>1.7.5</version>
</dependency>

This code in pom.xml directs Maven to download the darwinsys-api-1.7.5.jar file and store it (along with some metadata files) in a carefully constructed tree in my home directory (which is ~/.m2/repository/com/darwinsys/darwinsys-api/1.7.5). In this way, when two or more projects require the same JAR file, the JAR will be downloaded only once.

Here is a very selective look at the Maven local repository on one of my systems.

$ ls ~/.m2/repository
aopalliance biz bouncycastle cglib com dev eclipse edu info io
jakarta javax jaxen jline log4j ...
$ ls ~/.m2/repository/com/darwinsys/darwinsys-api
1.5.14
1.5.15
1.7.5
maven-metadata-central.xml
maven-metadata-central.xml.sha1
resolver-status.properties
$ ls ~/.m2/repository/com/darwinsys/darwinsys-api/1.7.5
_remote.repositories
darwinsys-api-1.7.5.jar
darwinsys-api-1.7.5.jar.sha1
darwinsys-api-1.7.5.pom
darwinsys-api-1.7.5.pom.sha1
$

By looking at the pom.xml file, not only is it clear which version of the API is used in that particular project, it’s also clear (at least if you know what the default is and that there is no other repository listed in the pom.xml file) that the JAR file came from the centralized Maven repository, Maven Central.

What’s more, the JAR file itself has its version number embedded in its filename.

Maven uses the Secure Hash Algorithm (sha) files to ensure that the JAR file hasn’t been tampered with. If you run the build tool in debug mode, you will see an extremely verbose output that includes the full path of each JAR file that is on the classpath. Plus, Maven has capabilities such as mvn dependency:tree to show all the sub- and sub-sub-dependencies in a tree format.

Keeping JAR dependencies under control is part of making software development a discipline. Make it so!

Worst practice #7: Meaningless names


Now is a good time to quote Ian’s First Rule of Coding:

You should never type more than a few characters of any name except when you’re creating it.

Given that most developers (except for two or three vi diehards) use a full-featured IDE these days, and since all major IDEs have really good code completion features, there’s no reason to type out long names.

But neither is there any reason to avoid giving meaningful names to methods, fields, classes, variables, and other elements.

Variable names such as i, j, and k are, in my book, allowed only when you’re using the old-style for loop to index an array or count something. Also allowed are names such as s for a locally used String, in the header of a few-lines-long method, or when you’re writing a lambda that is short and self-contained.

For everything else, pick a useful name.

This becomes particularly important where the var keyword is used to avoid having to give type declarations. Why? The variable name may be the only clue the reader has as to what you mean the variable to be used for. Consider the following example:

for (int i = 0; i < functionData.length; i++) {
        functionData[i] = someFunction(i);
}

customerNames.forEach(s->s.substring(1)); // "s" OK here

int bodyFontSize = 11;

I’m not only talking about variables: Method names should also be meaningful. In writing JUnit tests, you’ll find that names like test1() and test2() and so on are not only useless: They mislead, because such naming implies an ordering that isn’t there.

JUnit does not make any claim to run methods in the order in which you wrote them. Methods are, in fact, run in the order given by the reflection API, which is documented to return members that “are not sorted and are not in any particular order.”

Here is an example of this antipattern.

@Test
    public void test1() {   // Bad
        // test here...
    }

And here is a better way to write it.

@Test
    public void testPositiveResultsCorrect() { // Better
        // test here...
    }

Remember: You are one of the people most likely to need to read this code months or years after you wrote it, so be kind to yourself!

Worst practice #6: Reinventing the flat tire


This antipattern’s title is from a paper I worked on many years ago. “Reinventing the wheel” is a common English-language idiom for designing and creating something that already exists. My then-colleague Geoff Collyer and I took the expression one step further, in a C coding style paper Geoff and I co-wrote long ago in a galaxy far away. “Reinventing the flat tire” meant that a programmer not only wrote code whose functionality was readily available in a standard or common library, but that the new code did a worse job than the public API.

Here’s an example of this antipattern.

String[] candidates = getStrings();
String searchingFor = "The Lost Boys";
int found = -1;
for (int i = 0; i < candidates.length; i++) { // flat tire
    if (candidates[i].equals(searchingFor)) {
        found = i;
    }
}

And here is a better way.

Arrays.sort(candidates); // start of "better" approach
found = Arrays.binarySearch(candidates, searchingFor);

You might think the second approach would run more slowly, because a binary search requires the input be sorted. That’s true. But notice that the programmer of the antipattern forgot to break out of the loop when finding the match, so that code’s efficiency is terrible anyway.

Reinventing public APIs is nothing new and is often a sign of incomplete knowledge of the API. Of course, it’s easy enough to make that error when languages have such a vast standard library as Java has.

Here’s an example of reinventing an API you might or might not know; this has been in the platform since Java 1.7.

var x = getValue();     // legacy way
if (x == null) {
    x = getSomeDefaultValue();
}
System.out.println(x);

Here’s the better, shorter way.

var y = Objects.requireNonNullElse(getValue(), getSomeDefaultValue());
System.out.println(y);

The first example’s programmer could have used the standard Objects.requireNonNullElse() library routine, which has a variety of overloads that will help reduce coding for some common operations.

Source: oracle.com

Friday, September 16, 2022

Chaos Engineering – Metaspace OutOfMemoryError

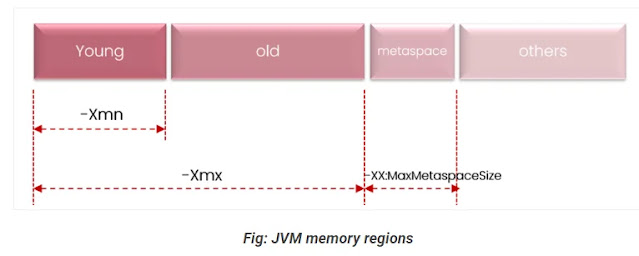
JVM memory has following regions:

Chaos Engineering, Oracle Java Certification, Oracle Java Career, Java Skills, Java Jobs, Java Tutorial and Materials

a. Young Generation

b. Old Generation

c. Metaspace

d. Others region

When you encounter ‘java.lang.OutOfMemoryError: Metaspace’ it indicates that the Metaspace region in the JVM memory is getting saturated. Metaspace is the region where metadata details that are required to execute your application are stored. In nutshell they contain Class definitions and method definitions of your application. To learn more about what gets stored in each of the JVM memory regions, you may refer to this video clip. In this post let’s discuss how one can simulate java.lang.OutOfMemoryError: Metaspace.

Simulating java.lang.OutOfMemoryError: Metaspace


To simulate ‘java.lang.OutOfMemoryError: Metaspace’, we wrote this program:

public class MetaspaceLeakProgram {
    
   public static void main(String[] args) throws Exception {
         
      ClassPool classPool = ClassPool.getDefault();
 
      while (true) {
             
         // Keep creating classes dynamically!
         String className = "com.buggyapp.MetaspaceObject" + UUID.randomUUID();
         classPool.makeClass(className).toClass();
      }
   }    
}

This program leverages the ‘ClassPool’ object from the opensource javassist library. This ‘ClassPool’ object is capable of creating new classes at runtime. Please take a close look at the above program. If you notice, this program keeps on creating new classes. Below is the sample class names generated by this program:

Chaos Engineering, Oracle Java Certification, Oracle Java Career, Java Skills, Java Jobs, Java Tutorial and Materials

com.buggyapp.MetaspaceObject76a9a309-c9c6-4e5f-a302-8340eb3acdef
com.buggyapp.MetaspaceObjectb9bd6832-bacd-4c7c-a6e6-3bfa19a85e80
com.buggyapp.MetaspaceObject81d9d086-7245-4304-818f-0bfcbf319fd3
com.buggyapp.MetaspaceObjecte27068b6-f4cb-498a-80d5-0e5b61c2ada0
com.buggyapp.MetaspaceObject06f9d773-d365-48c8-a5cc-9c69b3178f4c
:
:
:

Whenever a new class is created, its corresponding class metadata definitions are created in the JVM’s Metaspace region. Since metadata definitions are created in Metaspace, it’s size starts to grow. When the maximum metaspace size is reached, application will experience ‘java.lang.OutOfMemoryError: Metaspace’

java.lang.OutOfMemoryError: Metaspace causes


 ‘java.lang.OutOfMemoryError: Metaspace’ error happens because of two reasons:

 a. Metaspace region size is under allocated 

 b. Memory leak in the Metaspace region. 

You can address #a by increasing Metaspace region size. You can do this by passing the JVM argument ‘-XX:MaxMetaspaceSize’. 

In order to address #b, you have to do proper troubleshooting. Here is a post which walks through how to troubleshoot memory leaks in the Metaspace region.

Source: javacodegeeks.com

Wednesday, September 14, 2022

Monitoring WebLogic Server for Oracle Container Engine for Kubernetes

How to use open source tools to keep tabs on enterprise applications

 
Everyone should monitor their production system to understand how the system is behaving. Monitors help you understand the workloads and ensure you get notifications when something fails—or is about to fail.

In Java EE applications, you can choose to monitor many metrics on your servers that will identify workloads and issues with applications. For example, you could monitor the Java heap, active threads, open sockets, CPU utilization, and memory usage.

If you have a Java EE application deployed to Oracle WebLogic Server for Oracle Cloud Infrastructure Container Engine for Kubernetes, this article is for you.

Oracle WebLogic Server for Oracle Cloud Infrastructure Container Engine for Kubernetes can help you quickly create Oracle WebLogic configurations on Oracle Cloud, for example, to allocate network resources, reuse existing virtual cloud networks or subnets, configure the load balancer, integrate with Identity Cloud Manager, or configure Oracle Database.

In this article, I’ll show you how to use two open source tools—Grafana and Prometheus—to monitor an Oracle WebLogic domain deployed in Oracle WebLogic Server for Oracle Cloud Infrastructure Container Engine for Kubernetes.

By the way, this procedure will use several Helm charts to walk through the individual steps required to install and configure Prometheus and Grafana. For your own deployment, it is up to you to create a single Helm chart to deploy Prometheus or Grafana.

Prerequisites


Before you get started, you should have installed at least one of these Oracle Cloud Marketplace applications. (UCM refers to the Universal Credits model; BYOL stands for bring your own license.)


Deploy WebLogic Monitoring Exporter to your Oracle WebLogic domain


Here are the step-by-step instructions.

1. Open a terminal window and access the administration instance that is created with Oracle WebLogic Server for Oracle Cloud Infrastructure Container Engine for Kubernetes. You can see detailed instructions here.

2. Go to the root Oracle Cloud Infrastructure File Storage Service folder, which is /u01/shared.

cd /u01/shared

3. Download the WebLogic Monitoring Exporter war file from GitHub into the wlsdeploy folder.

wget https://github.com/oracle/weblogic-monitoring-exporter/releases/download/v2.0.0/wls-exporter.war -P wlsdeploy/applications

4. Include the sample exporter configuration file.

zip -r weblogic-exporter-archive.zip wlsdeploy/

wget https://raw.githubusercontent.com/oracle/weblogic-monitoring-exporter/master/samples/kubernetes/end2end/dashboard/exporter-config.yaml -O config.yml
zip wlsdeploy/applications/wls-exporter.war -m config.yml

5. Create a WebLogic Server Deploy Tooling archive where you’ll place the weblogic-exporter-archive.war file.

zip -r weblogic-exporter-archive.zip wlsdeploy/

6. Create a WebLogic Server Deploy Tooling model to deploy the WebLogic Monitoring Exporter application to your domain.

ADMIN_SERVER_NAME=$(curl -s -H "Authorization: Bearer Oracle" http://169.254.169.254/opc/v2/instance/ | jq -r '.metadata.wls_admin_server_name')
DOMAIN_CLUSTER_NAME=$(curl -s -H "Authorization: Bearer Oracle" http://169.254.169.254/opc/v2/instance/ | jq -r '.metadata.wls_cluster_name')

cat > deploy-monitoring-exporter.yaml << EOF
appDeployments:
  Application:
    'wls-exporter' :
      SourcePath: 'wlsdeploy/applications/wls-exporter.war'
      Target: '$DOMAIN_CLUSTER_NAME,$ADMIN_SERVER_NAME'
      ModuleType: war
      StagingMode: nostage
EOF

7. Deploy the WebLogic Monitoring Exporter application to your domain using the Pipeline update-domain screen.

8. From the Jenkins dashboard, open the Pipeline update-domain screen and specify the parameters, as follows (and see Figure 1):

◉ For Archive_Source, select Shared File System.
◉ For Archive_File_Location, enter /u01/shared/weblogic-exporter-archive.zip.
◉ For Domain_Model_Source, select Shared File System.
◉ For Model_File_Location, enter /u01/shared/deploy-monitoring-exporter.yaml.

Figure 1. The Pipeline update-domain parameters screen

Then click the build button. To verify that the deployment is working, run the following commands:

INGRESS_NS=$(curl -s -H "Authorization: Bearer Oracle" http://169.254.169.254/opc/v2/instance/ | jq -r '.metadata.ingress_namespace')
SERVICE_NAME=$(curl -s -H "Authorization: Bearer Oracle" http://169.254.169.254/opc/v2/instance/ | jq -r '.metadata.service_name')
WLS_CLUSTER_URL=$(kubectl get svc "$SERVICE_NAME-external" -n $INGRESS_NS -ojsonpath="{.status.loadBalancer.ingress[0].ip}")

The output should look something like the following:

[opc@wlsoke-admin ~]$ curl -k https://$WLS_CLUSTER_URL/wls-exporter
<!DOCTYPE html>
<html lang="en">
<head>
    <meta charset="UTF-8">
    <title>Weblogic Monitoring Exporter</title>
</head>

Create PersistentVolume and PersistentVolumeClaim for Grafana, Prometheus Server, and Prometheus Alertmanager

Oracle WebLogic Server for Oracle Cloud Infrastructure Container Engine for Kubernetes creates a shared file system using Oracle Cloud Infrastructure File Storage Service, which is mounted across the different pods running in the Oracle Container Engine for Kubernetes cluster and the administration host. To store data on that shared file system, the next step is to create subpaths for Grafana and Prometheus to store data.

This procedure will create a Helm chart with PersistentVolume (PV) and PersistentVolumeClaim (PVC) for Grafana, Prometheus Server, and Prometheus Alertmanager. This step doesn’t use the Prometheus and Grafana charts for creating the PVC because those don’t yet support Oracle Cloud Infrastructure Container Engine for Kubernetes with Oracle Cloud Infrastructure File Storage Service.

1. Open a terminal window and access the administration instance that is created with Oracle WebLogic Server for Oracle Cloud Infrastructure Container Engine for Kubernetes.

2. Create folders for monitoringpv and templates. You’ll place the Helm chart here.

mkdir -p monitoringpv/templates

3. Create the Chart.yaml file in the monitoringpv folder.

cat > monitoringpv/Chart.yaml << EOF
apiVersion: v1
appVersion: "1.0"
description: A Helm chart for creating pv and pvc for Grafana, Prometheus and Alertmanager
name: monitoringpv
version: 0.1.0
EOF

4. Similarly, create the values.yaml file required for the chart using the administration instance metadata.

cat > monitoringpv/values.yaml << EOF
exportpath: $(curl -s -H "Authorization: Bearer Oracle" http://169.254.169.254/opc/v2/instance/ | jq -r '.metadata.fss_export_path')
classname: $(curl -s -H "Authorization: Bearer Oracle" http://169.254.169.254/opc/v2/instance/ | jq -r '.metadata.fss_chart_name')
serverip: $(kubectl get pv jenkins-oke-pv -o jsonpath='{.spec.nfs.server}')
EOF

5. Create the target folders on the shared file system.

mkdir /u01/shared/alertmanager
mkdir /u01/shared/prometheus
mkdir /u01/shared/grafana

6. Create template files for PV and PVC for Grafana, Prometheus Server, and Prometheus Alertmanager.

cat > monitoringpv/templates/grafanapv.yaml << EOF
apiVersion: v1
kind: PersistentVolume
metadata:
  name: pv-grafana
spec:
  accessModes:
  - ReadWriteMany
  capacity:
    storage: 10Gi
  mountOptions:
  - nosuid
  nfs:
    path: {{ .Values.exportpath }}{{"/grafana"}}
    server: "{{ .Values.serverip }}"
  persistentVolumeReclaimPolicy: Retain
  storageClassName: "{{ .Values.classname }}"
  volumeMode: Filesystem
EOF

cat > monitoringpv/templates/grafanapvc.yaml << EOF
apiVersion: v1
kind: PersistentVolumeClaim
metadata:
  name: pvc-grafana
  namespace: monitoring
spec:
  accessModes:
  - ReadWriteMany
  resources:
    requests:
      storage: 10Gi
  storageClassName: "{{ .Values.classname }}"
  volumeMode: Filesystem
  volumeName: pv-grafana
EOF

cat > monitoringpv/templates/prometheuspv.yaml << EOF
apiVersion: v1
kind: PersistentVolume
metadata:
  name: pv-prometheus
spec:
  accessModes:
  - ReadWriteMany
  capacity:
    storage: 10Gi
  mountOptions:
  - nosuid
  nfs:
    path: {{ .Values.exportpath }}{{"/prometheus"}}
    server: "{{ .Values.serverip }}"
  persistentVolumeReclaimPolicy: Retain
  storageClassName: "{{ .Values.classname }}"
  volumeMode: Filesystem
EOF

cat > monitoringpv/templates/prometheuspvc.yaml << EOF
apiVersion: v1
kind: PersistentVolumeClaim
metadata:
  name: pvc-prometheus
  namespace: monitoring
spec:
  accessModes:
  - ReadWriteMany
  resources:
    requests:
      storage: 10Gi
  storageClassName: "{{ .Values.classname }}"
  volumeMode: Filesystem
  volumeName: pv-prometheus
EOF

cat > monitoringpv/templates/alertmanagerpv.yaml << EOF
apiVersion: v1
kind: PersistentVolume
metadata:
  name: pv-alertmanager
spec:
  accessModes:
  - ReadWriteMany
  capacity:
    storage: 10Gi
  mountOptions:
  - nosuid
  nfs:
    path: {{ .Values.exportpath }}{{"/alertmanager"}}
    server: "{{ .Values.serverip }}"
  persistentVolumeReclaimPolicy: Retain
  storageClassName: "{{ .Values.classname }}"
  volumeMode: Filesystem
EOF

cat > monitoringpv/templates/alermanagerpvc.yaml << EOF
apiVersion: v1
kind: PersistentVolumeClaim
metadata:
  name: pvc-alertmanager
  namespace: monitoring
spec:
  accessModes:
  - ReadWriteMany
  resources:
    requests:
      storage: 10Gi
  storageClassName: "{{ .Values.classname }}"
  volumeName: pv-alertmanager
EOF

7. Install the monitoringpv Helm chart you created.

helm install monitoringpv monitoringpv --create-namespace --namespace monitoring --wait

8. Verify that the output looks something like the following:

[opc@wlsoke-admin ~]$ helm install monitoringpv monitoringpv --namespace monitoring --wait
NAME: monitoringpv
LAST DEPLOYED: Wed Apr  15 16:43:41 2021
NAMESPACE: default
STATUS: deployed
REVISION: 1
TEST SUITE: None

Install the Prometheus Helm chart

These instructions are a subset of those in the Prometheus Community Kubernetes Helm Charts GitHub project. Do these steps in the same terminal window where you accessed the administration instance created with Oracle WebLogic Server for Oracle Cloud Infrastructure Container Engine for Kubernetes:

1. Add the required Helm repositories.

helm repo add prometheus-community https://prometheus-community.github.io/helm-charts
helm repo add kube-state-metrics https://kubernetes.github.io/kube-state-metrics
helm repo update

At this time, you could optionally inspect all of Helm’s available configurable options by showing Prometheus’ values.yaml file.

helm show values prometheus-community/prometheus

2. Copy the needed values from the WebLogic Monitoring Exporter GitHub project to the Prometheus directory.

wget https://raw.githubusercontent.com/oracle/weblogic-monitoring-exporter/master/samples/kubernetes/end2end/prometheus/values.yaml -P prometheus

3. To customize your Prometheus deployment with your own domain information, create a custom-values.yaml file to override some of the values from the prior step.

DOMAIN_NS=$(curl -s -H "Authorization: Bearer Oracle" http://169.254.169.254/opc/v2/instance/ | jq -r '.metadata.wls_domain_namespace')
DOMAIN_NAME=$(curl -s -H "Authorization: Bearer Oracle" http://169.254.169.254/opc/v2/instance/ | jq -r '.metadata.wls_domain_uid')
DOMAIN_CLUSTER_NAME=$(curl -s -H "Authorization: Bearer Oracle" http://169.254.169.254/opc/v2/instance/ | jq -r '.metadata.wls_cluster_name')

cat > prometheus/custom-values.yaml << EOF
alertmanager:
  prefixURL: '/alertmanager'
  baseURL: http://localhost:9093/alertmanager
nodeExporter:
  hostRootfs: false
server:
  prefixURL: '/prometheus'
  baseURL: "http://localhost:9090/prometheus"
extraScrapeConfigs: |
    - job_name: '$DOMAIN_NAME'
      kubernetes_sd_configs:
      - role: pod
      relabel_configs:
      - source_labels: [__meta_kubernetes_namespace, __meta_kubernetes_pod_label_weblogic_domainUID, __meta_kubernetes_pod_label_weblogic_clusterName]
        action: keep
        regex: $DOMAIN_NS;$DOMAIN_NAME;$DOMAIN_CLUSTER_NAME
      - source_labels: [__meta_kubernetes_pod_annotation_prometheus_io_path]
        action: replace
        target_label: __metrics_path__
        regex: (.+)
      - source_labels: [__address__, __meta_kubernetes_pod_annotation_prometheus_io_port]
        action: replace
        regex: ([^:]+)(?::\d+)?;(\d+)
        replacement: \$1:\$2
        target_label: __address__
      - action: labelmap
        regex: __meta_kubernetes_pod_label_(.+)
      - source_labels: [__meta_kubernetes_pod_name]
        action: replace
        target_label: pod_name
      basic_auth:
        username: --FIX ME--
        password: --FIX ME--
EOF

4. Open the custom-values.yaml file and update the username and password. Use the credentials you use to log in to the administrative console.

basic_auth:
        username: myadminuser
        password: myadminpwd

5. Install the Prometheus chart.

helm install --wait prometheus prometheus-community/prometheus --namespace monitoring -f prometheus/values.yaml -f prometheus/custom-values.yaml

6. Verify that the output looks something like the following:

[opc@wlsoke-admin ~]$ helm install --wait prometheus prometheus-community/prometheus --namespace monitoring -f prometheus/values.yaml -f prometheus/custom-values.yaml
NAME: prometheus
LAST DEPLOYED: Wed Apr  15 22:35:15 2021
NAMESPACE: monitoring
STATUS: deployed
REVISION: 1
TEST SUITE: None
NOTES:
. . .

7. Create an ingress file to expose Prometheus through the internal load balancer.

cat << EOF | kubectl apply -f -
apiVersion: extensions/v1beta1
kind: Ingress
metadata:
  annotations:
    kubernetes.io/ingress.class: nginx
  name: prometheus
  namespace: monitoring
spec:
  rules:
  - http:
      paths:
      - backend:
          serviceName: prometheus-server
          servicePort: 80
        path: /prometheus
EOF

8. The Prometheus dashboard should now be available at the same IP address used to access the Oracle WebLogic Server Administration Console or the Jenkins console but at the /Prometheus path (see Figure 2).

Figure 2. The Prometheus dashboard

Install the Grafana Helm chart

The instructions described here are a subset of those in the Grafana Community Kubernetes Helm Charts GitHub project. As before, do these steps within the same terminal window where you accessed the administration instance created with Oracle WebLogic Server for Oracle Cloud Infrastructure Container Engine for Kubernetes.

1. Add the Grafana charts repository.

helm repo add grafana https://grafana.github.io/helm-charts
helm repo update

2. Create a values.yaml file to customize the Grafana installation.

INGRESS_NS=$(curl -s -H "Authorization: Bearer Oracle" http://169.254.169.254/opc/v2/instance/ | jq -r '.metadata.ingress_namespace')

SERVICE_NAME=$(curl -s -H "Authorization: Bearer Oracle" http://169.254.169.254/opc/v2/instance/ | jq -r '.metadata.service_name')

INTERNAL_LB_IP=$(kubectl get svc "$SERVICE_NAME-internal" -n $INGRESS_NS -ojsonpath="{.status.loadBalancer.ingress[0].ip}")

mkdir grafana

cat > grafana/values.yaml << EOF
persistence:
  enabled: true
  existingClaim: pvc-grafana

admin:
  existingSecret: "grafana-secret"
  userKey: username
  passwordKey: password

grafana.ini:
  server:
    domain: "$INTERNAL_LB_IP"
    root_url: "%(protocol)s://%(domain)s:%(http_port)s/grafana/"
    serve_from_sub_path: true
EOF

3. Create a grafana-secret Kubernetes secret file containing admin credentials for Grafana server (with your own credentials, of course).

kubectl --namespace monitoring create secret generic grafana-secret --from-literal=username=your username --from-literal=password=yourpassword

4. Install the Grafana Helm chart.

helm install --wait grafana grafana/grafana --namespace monitoring -f grafana/values.yaml

5. Verify that the output looks something like the following:

[opc@wlsoke-admin ~]$ helm install --wait grafana grafana/grafana --namespace monitoring -f grafana/values.yaml
NAME: grafana
LAST DEPLOYED: Fri Apr  16 16:40:21 2021
NAMESPACE: monitoring
STATUS: deployed
REVISION: 1
NOTES:
. . .

6. Expose the Grafana dashboard using the ingress controller.

cat <<EOF | kubectl apply -f -
apiVersion: extensions/v1beta1
kind: Ingress
metadata:
  annotations:
    kubernetes.io/ingress.class: nginx
  name: grafana
  namespace: monitoring
spec:
  rules:
  - http:
      paths:
      - backend:
          serviceName: grafana
          servicePort: 80
        path: /grafana
EOF

7. The Grafana dashboard should now be available at the same IP address used to access the Oracle WebLogic Server Administration Console or the Jenkins console and Prometheus but at the /Grafana path (see Figure 3). You should log in with the credentials you configured in the secret file. 

Figure 3. The Grafana login screen

Create the Grafana data source

For this article, I’ll reuse the steps described in the WebLogic Monitoring Exporter sample. You can find the full documentation on how to create Grafana data sources in the Grafana documentation.

1. Once you log in to the Grafana dashboard (as shown in Figure 3), go to Configuration > Data Sources (see Figure 4) and click Add data source to go to the screen where you add the new data source (see Figure 5).

Figure 4. The Configuration menu with the Data Sources option

Figure 5.The screen where you add a new data source

2. Select Prometheus as the data source type (see Figure 6).

Figure 6. Choose Prometheus as the data source type.

3. Set the URL to http://<INTERNAL_LB_IP>/prometheus and click the Save&Test button (see Figure 7).

Important note. INTERNAL_LB_IP is the same IP address you use to access Grafana, Prometheus, Jenkins, and Oracle WebLogic Server Administration Console. You can see how to get that address in this document.

Figure 7. Set the URL for the data source; be sure to use your own IP address.

Import the Oracle WebLogic Server dashboard into Grafana

1. Log in to the Grafana dashboard. Navigate to Dashboards > Manage and click Import (see Figure 8).

Figure 8. The screen for importing a new dashboard

2. Open this JSON code file in a browser. Copy the contents into the Import via panel json section of the dashboard screen and click Load (see Figure 9).

Figure 9. This is where you’ll paste the JSON code.

3. Click the Import button and verify you can see the Oracle WebLogic Server dashboard on Grafana (see Figure 10). That’s it! You’re done!

Figure 10. The Oracle WebLogic Server dashboard running within Grafana

Source: oracle.com